
Female Top Managers in GCC and Africa: Latest World Bank Firm Statistics
November 19, 2026 · Research, Women Empowerment · 6 min read
Written by MATSH Research & Editorial Team · Last updated
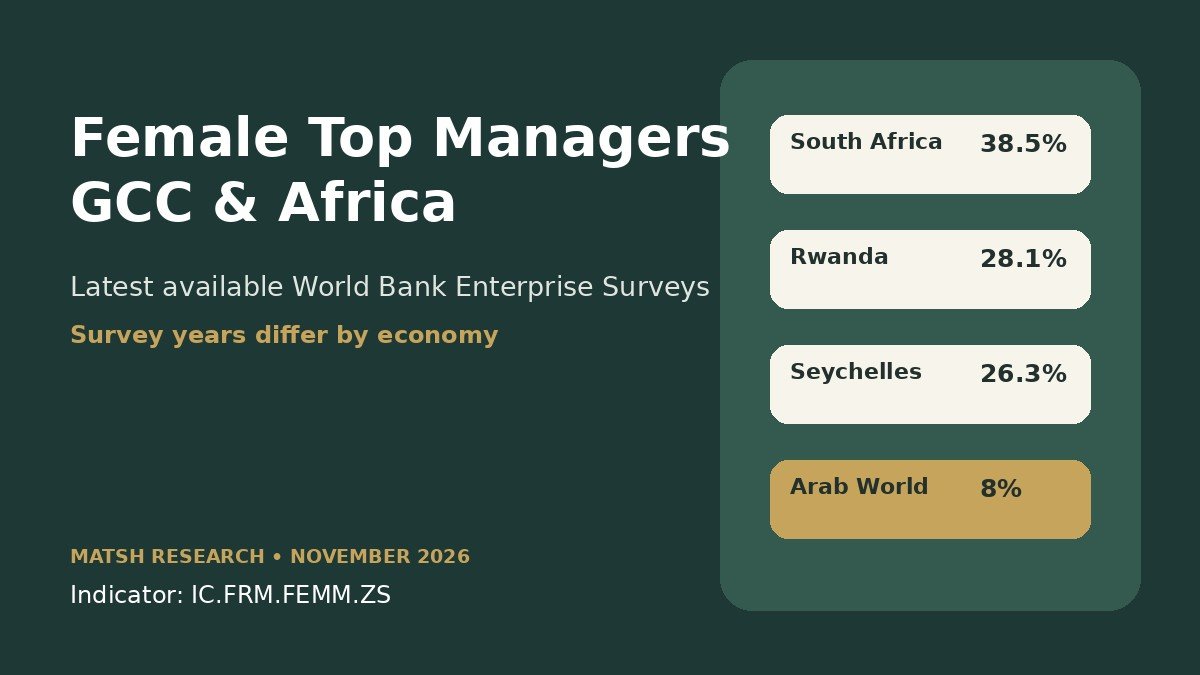
How common is it for a private-sector firm to have a woman as its highest-ranking manager? The World Bank Enterprise Surveys provide a specific firm-level indicator for that question. The latest available data show substantial differences across GCC and African economies, but the survey years also differ, so a clean comparison needs to show both the percentage and the year of observation.
This report compiles the latest available values for selected GCC and African economies from World Bank indicator IC.FRM.FEMM.ZS, “Firms with female top manager (% of firms).” It is designed as a reusable reference for employers, researchers, programme designers and journalists who need the underlying country values without mixing them with other measures such as labour-force participation, board representation or female business ownership.
Download the selected-country CSV
What the indicator actually measures
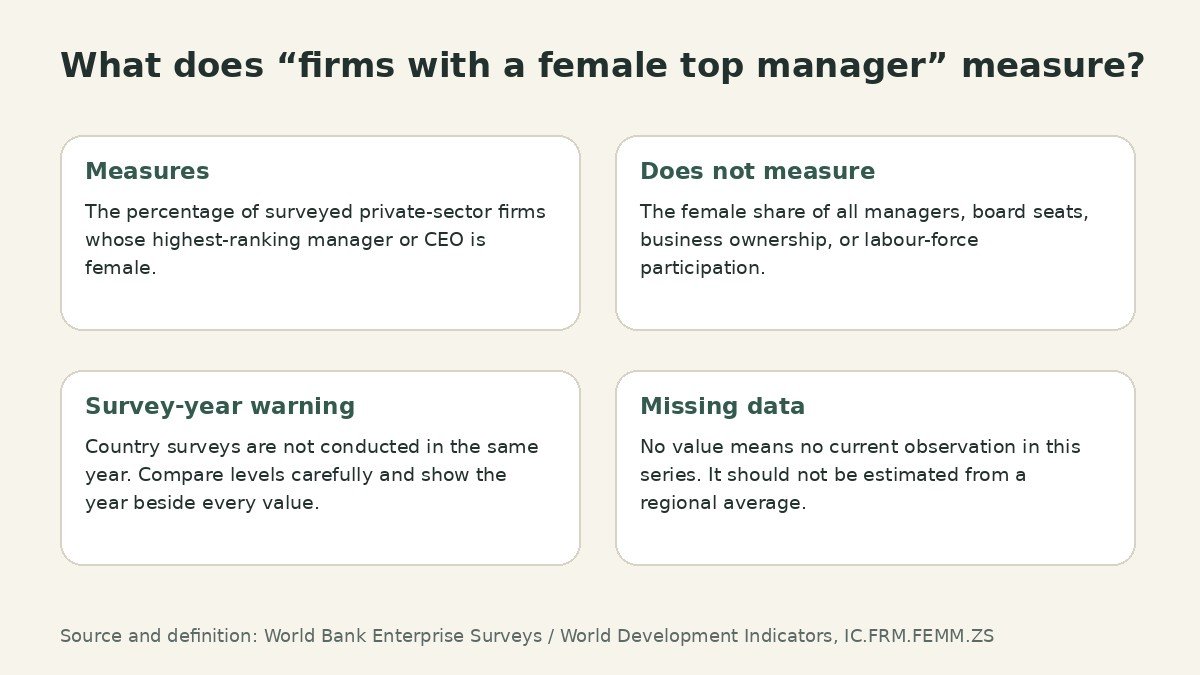
The World Bank defines this indicator as the percentage of surveyed private-sector firms whose top manager is female. The top manager is the highest-ranking manager or chief executive of the establishment and may also be an owner if that person works as the manager.
GCC firm-level data
The World Bank’s current series provides recent observations for Bahrain, Kuwait, Qatar and Saudi Arabia. The current indicator page does not provide a comparable value for the United Arab Emirates or Oman, so those two economies are shown as unavailable rather than estimated.
| GCC economy | Latest survey year shown | Firms with female top manager | Interpretation note |
|---|---|---|---|
| Bahrain | 2024 | 8.9% | World Bank Enterprise Survey country result. |
| Kuwait | 2025 | 2.8% | Latest value displayed by the World Bank series. |
| Qatar | 2025 | 1.4% | Latest value displayed by the World Bank series. |
| Saudi Arabia | 2025 | 1.8% | Latest value displayed by the World Bank series. |
| United Arab Emirates | — | Not available | No current observation in this series. Do not infer a value from the Arab World aggregate. |
| Oman | — | Not available | No current observation in this series. Do not infer a value from neighbouring GCC economies. |
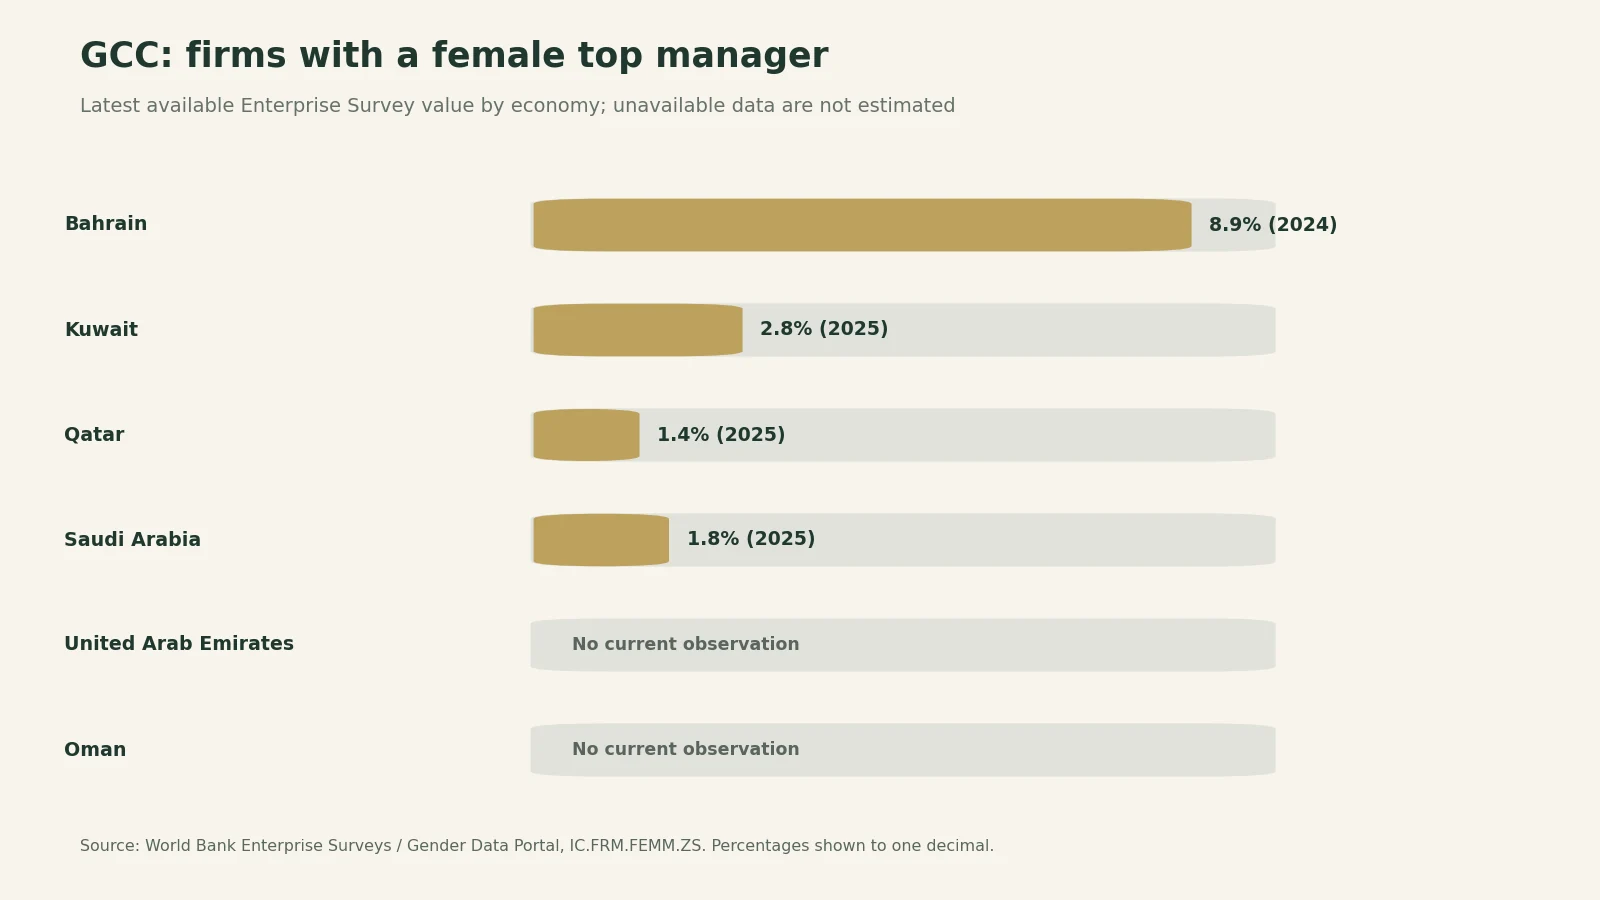
The GCC table should not be read as a complete ranking of women’s leadership in the region. First, two countries lack a current observation in this particular indicator. Second, the measure covers surveyed private-sector firms, not government leadership, boards, the entire management workforce or women’s overall economic participation.
Selected African economies
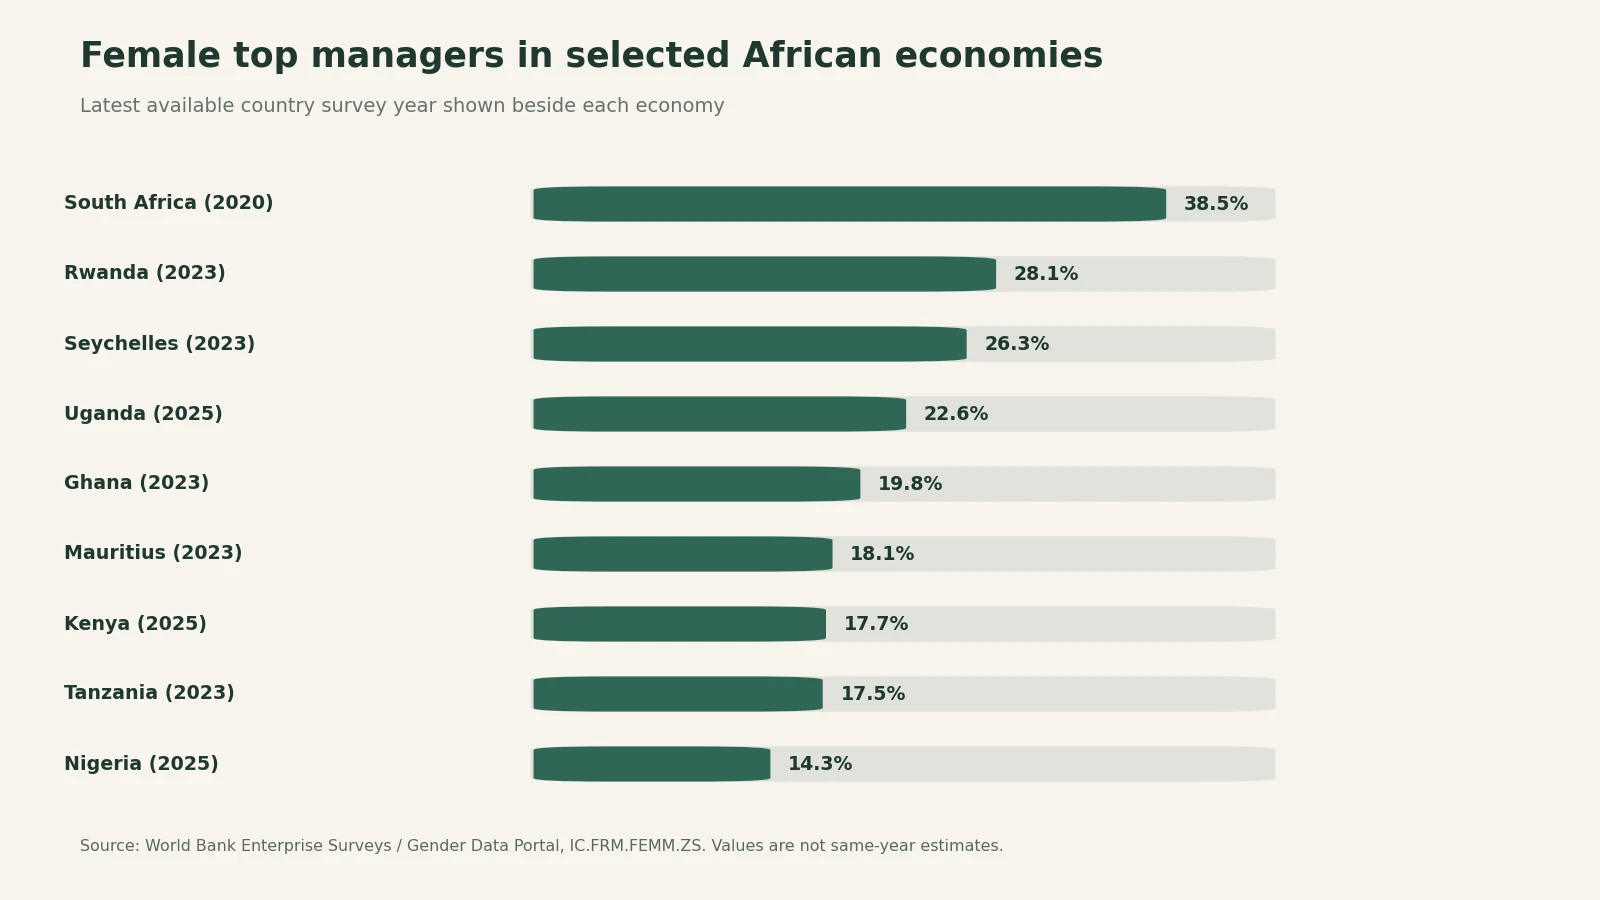
The selected African economies illustrate both variation in the measured share and the importance of survey timing. South Africa’s latest observation in this series is from 2020, while Kenya, Nigeria and Uganda have 2025 observations. Seychelles, Ghana, Rwanda, Tanzania and Mauritius use 2023 observations.
| Economy | Latest survey year shown | Firms with female top manager |
|---|---|---|
| South Africa | 2020 | 38.5% |
| Rwanda | 2023 | 28.1% |
| Seychelles | 2023 | 26.3% |
| Uganda | 2025 | 22.6% |
| Ghana | 2023 | 19.8% |
| Mauritius | 2023 | 18.1% |
| Kenya | 2025 | 17.7% |
| Tanzania | 2023 | 17.5% |
| Nigeria | 2025 | 14.3% |
Regional context
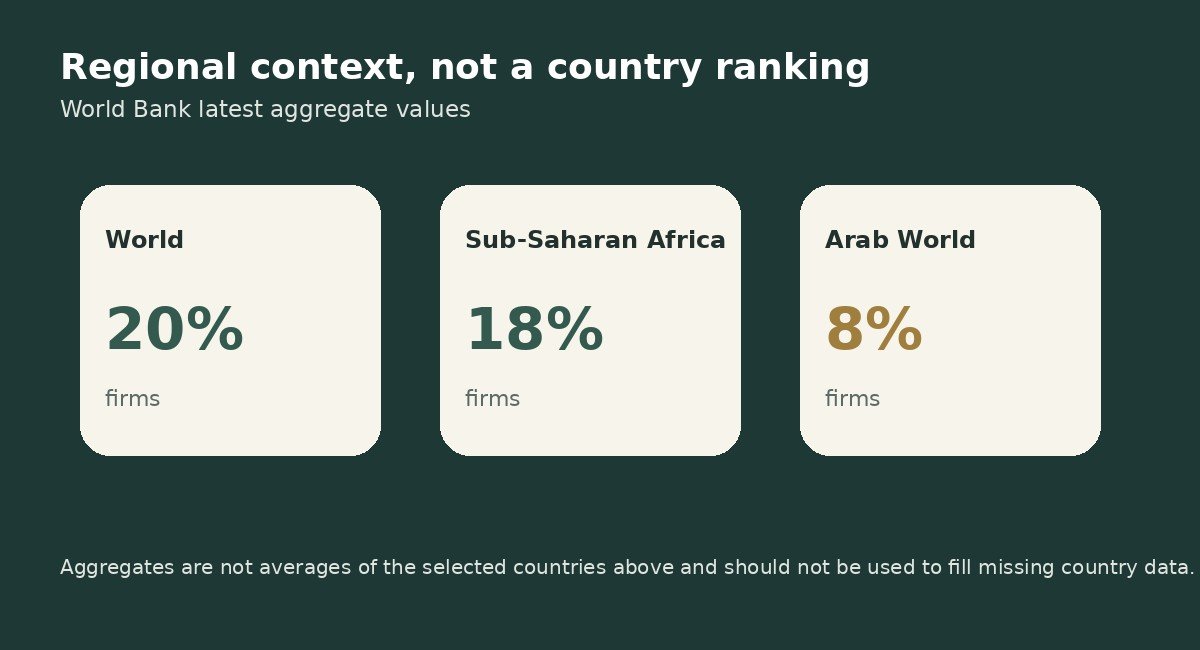
The World Bank’s current indicator pages show a latest world aggregate of 20%, a Sub-Saharan Africa aggregate of 18%, and an Arab World aggregate of 8%. These aggregates provide broad context, but they should not be used to fill missing country data or to claim that every country within a region has the same pattern.
Why the survey year matters
Enterprise Surveys are not fielded in every economy every year. A country’s “latest available” observation may therefore be several years older than another country’s. That makes the table useful for describing the latest available survey evidence, but not for claiming that all values describe the same moment in time.
For example, South Africa’s 38.5% observation is from 2020, while Kenya’s and Nigeria’s latest displayed observations are from 2025. It would be misleading to describe those as a single 2025 league table. The correct wording is “latest available World Bank Enterprise Survey value,” with the survey year shown next to the percentage.
What this can tell employers and programme designers
The indicator is useful as a signal of representation at the very top of surveyed firms. It can help organisations ask better questions about leadership pipelines, progression systems and access to senior responsibility. It cannot, on its own, explain why one country has a higher or lower observed share.
A lower measured share does not prove a lack of qualified women, and a higher share does not prove that leadership systems are equitable. Differences can reflect sector composition, firm size, survey coverage, labour-market structures, ownership patterns, career pipelines and many other factors. Organisations therefore need internal evidence as well: promotion rates, succession pools, access to strategic assignments, sponsorship, retention, pay, role level and the composition of applicant and candidate pools.
Training alone is not a leadership pipeline
Leadership development can improve capability, but representation changes through systems that determine who gets experience, visibility, sponsorship, promotion and succession opportunities. MATSH’s related guide, Women’s Leadership Development: Why Training Alone Does Not Build a Leadership Pipeline, explains why a programme should be connected to assignments, talent reviews and progression decisions rather than treated as a standalone intervention.
For organisations designing programmes, related resources include sponsorship versus mentoring for women leaders, women-on-boards readiness, and MATSH’s women empowerment course portfolio.
Country context and training routes
For organisations in the markets highlighted here, MATSH also maintains country and regional training pages for Saudi Arabia, the UAE, Kenya, Nigeria and Seychelles, plus broader GCC and Africa hubs.
Methodology and limitations
- Indicator: IC.FRM.FEMM.ZS, Firms with female top manager (% of firms).
- Primary source: World Bank Enterprise Surveys.
- Unit: percentage of surveyed private-sector firms.
- Country timing: latest available observation differs by country.
- Missing observations: shown as unavailable, not estimated.
- Rounding: values are reported as displayed by the World Bank source; where the World Bank gender-data table exposes a decimal, that decimal is retained.
- Scope: this is not a measure of all managers, board membership, female ownership, labour-force participation or public-sector leadership.
- Compilation date: 12 November 2026.
Primary sources
How to cite this page
Suggested citation: MATSH People Development (2026), “Female Top Managers in GCC and Africa: Latest World Bank Firm Statistics.” When reusing a country value, include the survey year and cite the underlying World Bank Enterprise Surveys indicator as the primary data source.
Need In-House Training?
We run all our courses as private programmes for organisations across the GCC and Africa.
Request In-House →