
Women’s labour-force participation: a country-by-country 2025 data reference
One comparable ILO-modelled indicator for all six GCC states and 33 selected African economies, plus explanatory figures, programme-design implications and a downloadable country data file. This is participation in the labour force, not the share of employees who are women.
Reference year: 2025 · Source: World Bank / ILOEST · Indicator: SL.TLF.CACT.FE.ZS · Age: 15+
Women’s workforce participation is an important measure of economic opportunity, but it is often presented as if a higher percentage automatically means better jobs, higher pay or greater decision-making power. It does not. This report keeps the definition fixed: female labour-force participation as a percentage of the total female population aged 15 and over, using the World Bank’s published ILO modelled series for 2025.
All figures refer to women aged 15+ within the ILO modelled annual estimate; they are not female employment rates or citizen-only measures. Source: World Bank WDI.
What female labour-force participation actually means
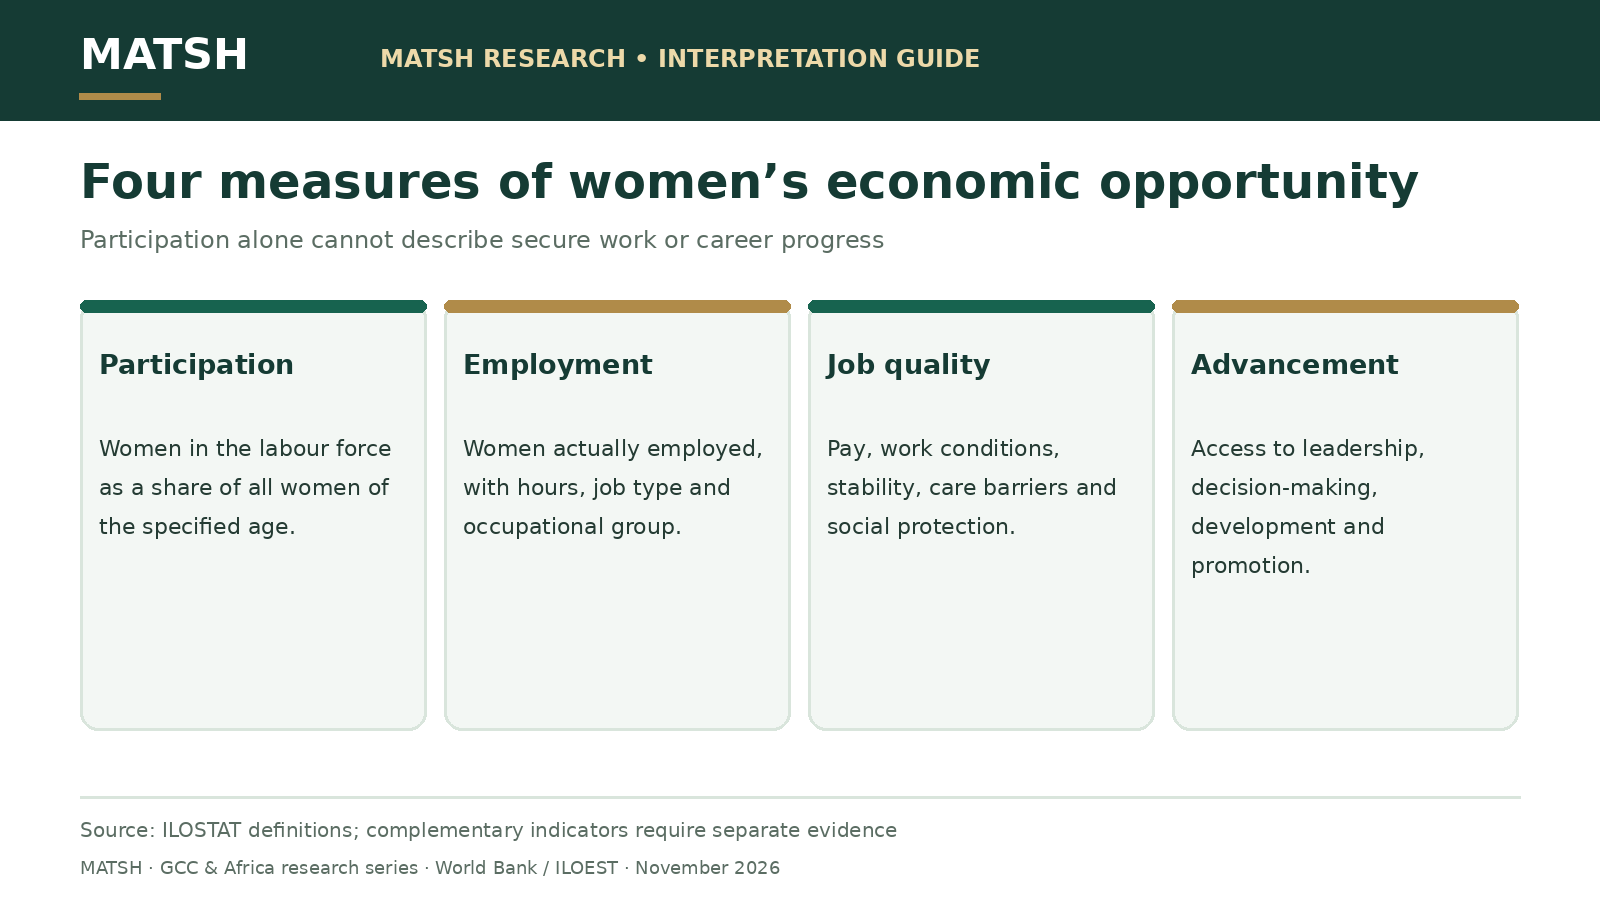
The labour force includes people who are employed and those who are unemployed under the statistical definition. Labour-force participation is the share of the working-age population in either category. It therefore differs from the employment-to-population ratio, which counts people in work, and from the percentage of workers who are women, which uses the total labour force or workforce as a different denominator.
Women in employment or unemployment as a proportion of the female population aged 15+.
Women actually employed as a share of the relevant female population. It excludes unemployed women.
Representation in specific management positions. It measures seniority and occupational mix, not overall labour-force activity.
Separate questions requiring wage, hours, contract, safety and decision-making evidence.
The ILO modelled series provides a harmonised annual estimate that can be compared across many countries. It may not exactly match a national quarterly labour-force release, a citizens-only national employment statistic or a source using a different working-age cutoff. Readers should use a consistent series when calculating a cross-country contrast.
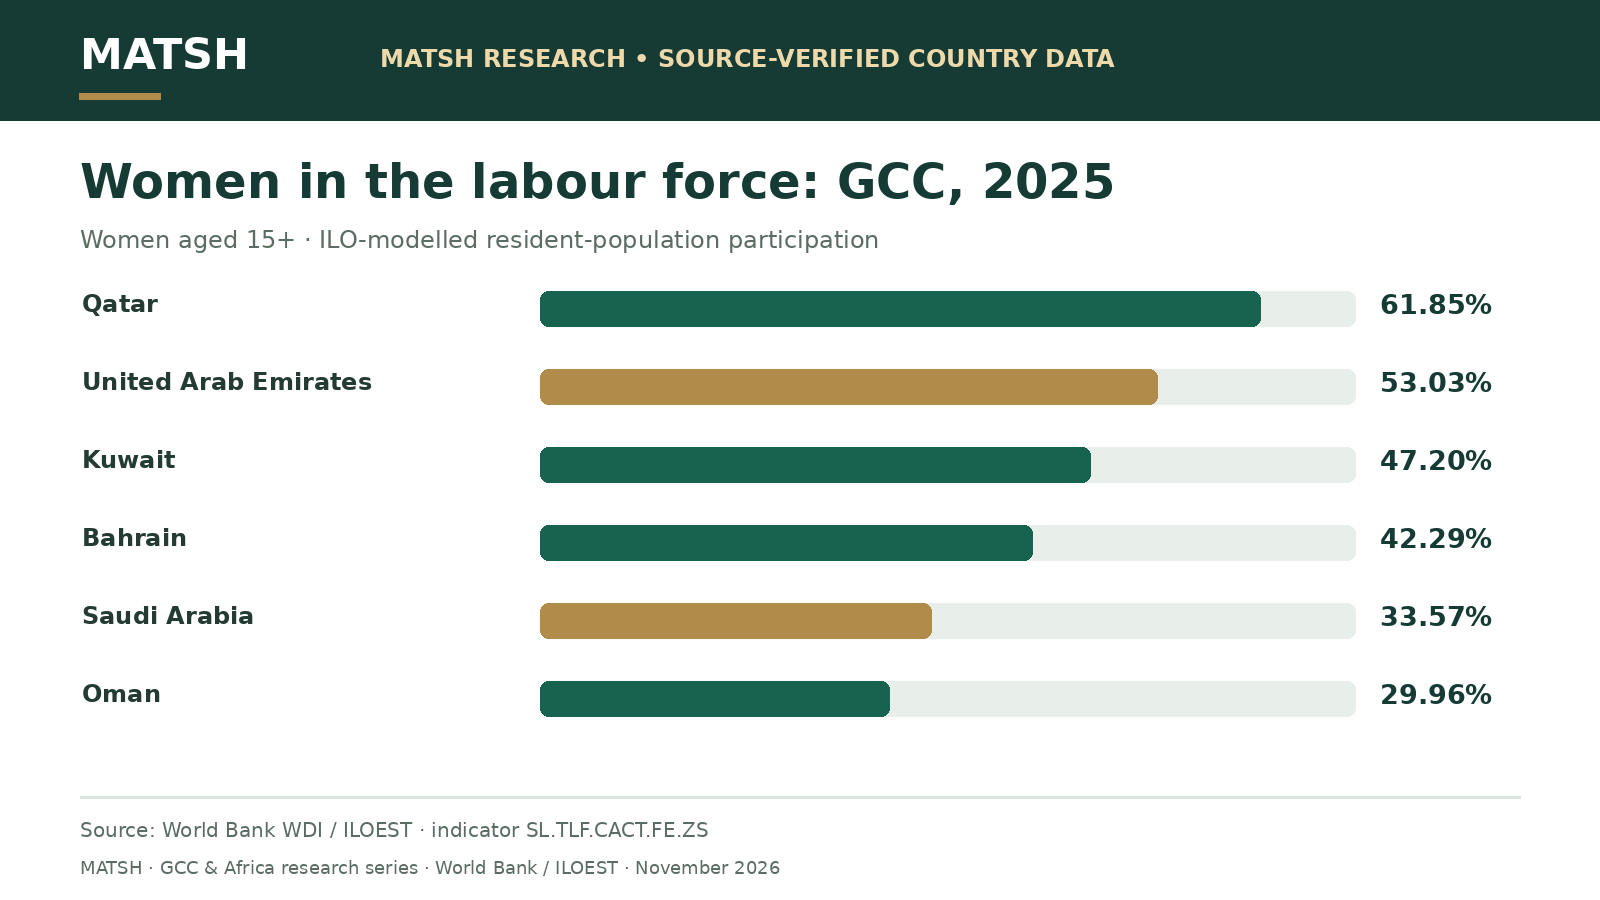
All six GCC countries: female participation rates in 2025
The six-country range in this series is wide. Qatar is at 61.85%, while Oman is at 29.96%; the UAE is at 53.03%, Kuwait at 47.20%, Bahrain at 42.29%, and Saudi Arabia at 33.57%. But GCC resident populations have varied mixes of citizens and expatriate workers, including large differences in migration-linked employment. A rate for all resident women is not a direct measure of citizen women’s employment or the result of a single government programme.
61.85%
53.03%
47.20%
42.29%
33.57%
29.96%
One 2025 ILO modelled indicator, women aged 15+. Source: World Bank / ILOEST, 2025.
| Country | 2025 female participation, age 15+ | Model/source |
|---|---|---|
| Bahrain | 42.29% | ILO modelled, 2025 |
| Kuwait | 47.20% | ILO modelled, 2025 |
| Oman | 29.96% | ILO modelled, 2025 |
| Qatar | 61.85% | ILO modelled, 2025 |
| Saudi Arabia | 33.57% | ILO modelled, 2025 |
| United Arab Emirates | 53.03% | ILO modelled, 2025 |
For Saudi Arabia, compare the 33.57% annual modelled all-resident value here only with the same indicator and reference definition. A GASTAT quarterly release focused on Saudi nationals has a different reference population and period. It is not a numerical contradiction if those national figures differ. This distinction is essential for any responsible GCC women-in-work dashboard.
African workforce participation: 33 selected economies
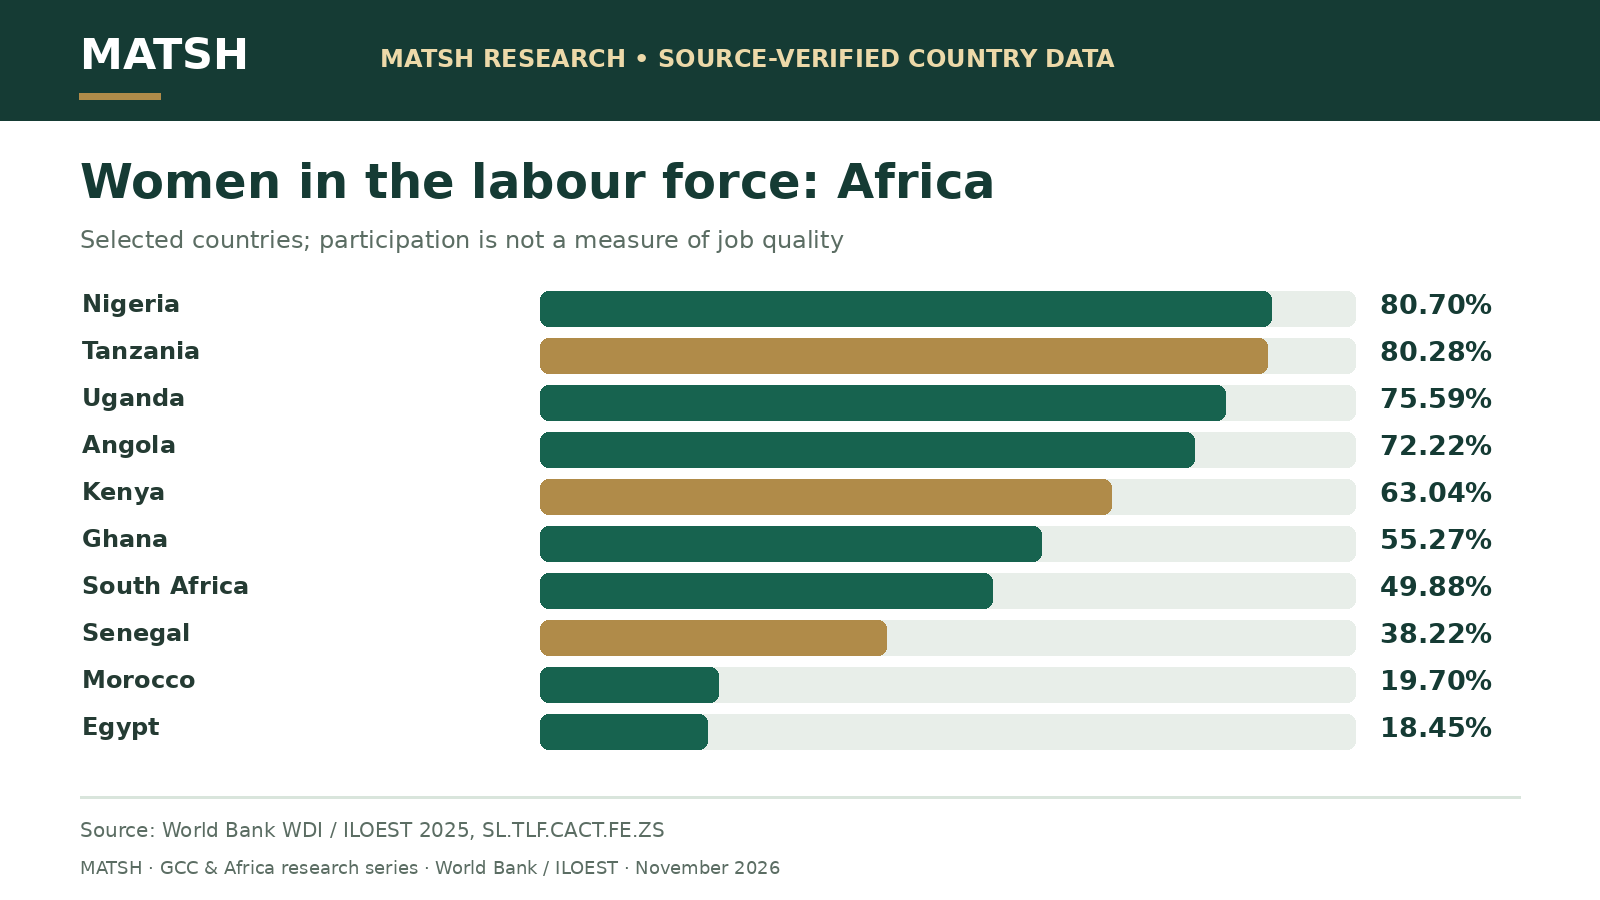
Africa contains very different patterns of paid employment, informal work, household enterprises, agricultural livelihoods, job-seeking behaviour and education access. The ILOEST data allow a common indicator to be compared, but they do not establish whether employment is formal, voluntary, safe or well paid. Nigeria’s high estimated participation figure, for example, should not be mistaken for a ranking of women’s economic security.
82.91%
80.70%
80.28%
77.09%
75.59%
75.16%
72.78%
72.22%
65.58%
63.71%
63.04%
62.16%
Country values are not adjusted for job quality or formality. Source: World Bank / ILOEST, 2025.
14.14%
18.45%
19.36%
19.70%
20.70%
26.18%
26.50%
32.99%
38.22%
47.46%
47.65%
49.88%
Low participation calls for local analysis, not an automatic diagnosis of cause. Source: World Bank / ILOEST, 2025.
| Country | 2025 female participation, age 15+ | Model/source |
|---|---|---|
| Algeria | 14.14% | ILO modelled, 2025 |
| Angola | 72.22% | ILO modelled, 2025 |
| Benin | 75.16% | ILO modelled, 2025 |
| Botswana | 63.71% | ILO modelled, 2025 |
| Comoros | 47.65% | ILO modelled, 2025 |
| Congo, Dem. Rep. | 61.85% | ILO modelled, 2025 |
| Congo, Rep. | 65.58% | ILO modelled, 2025 |
| Cote d’Ivoire | 59.45% | ILO modelled, 2025 |
| Djibouti | 19.36% | ILO modelled, 2025 |
| Egypt | 18.45% | ILO modelled, 2025 |
| Ethiopia | 58.46% | ILO modelled, 2025 |
| Ghana | 55.27% | ILO modelled, 2025 |
| Kenya | 63.04% | ILO modelled, 2025 |
| Libya | 32.99% | ILO modelled, 2025 |
| Madagascar | 82.91% | ILO modelled, 2025 |
| Malawi | 58.18% | ILO modelled, 2025 |
| Mauritania | 26.18% | ILO modelled, 2025 |
| Mauritius | 47.46% | ILO modelled, 2025 |
| Morocco | 19.70% | ILO modelled, 2025 |
| Mozambique | 77.09% | ILO modelled, 2025 |
| Namibia | 54.92% | ILO modelled, 2025 |
| Niger | 72.78% | ILO modelled, 2025 |
| Nigeria | 80.70% | ILO modelled, 2025 |
| Rwanda | 57.30% | ILO modelled, 2025 |
| Senegal | 38.22% | ILO modelled, 2025 |
| Sierra Leone | 51.60% | ILO modelled, 2025 |
| Somalia | 20.70% | ILO modelled, 2025 |
| South Africa | 49.88% | ILO modelled, 2025 |
| Tanzania | 80.28% | ILO modelled, 2025 |
| Tunisia | 26.50% | ILO modelled, 2025 |
| Uganda | 75.59% | ILO modelled, 2025 |
| Zambia | 56.43% | ILO modelled, 2025 |
| Zimbabwe | 62.16% | ILO modelled, 2025 |
Programme interpretation: a country where many women participate in work may still have significant unmet needs in income security, financial inclusion, health and safety, skills recognition, or progression. In a country where fewer women participate, the binding constraints could include job availability, care infrastructure, legal restrictions, education, mobility, occupational segregation or measurement choices. This table does not identify which mechanism dominates. Appropriate country research must do that work.
Why a GCC–Africa ranking is not a policy scorecard
33.57%
53.03%
61.85%
63.04%
55.27%
80.70%
49.88%
18.45%
Selected examples only. The rates are all-resident modelled annual estimates, not a measure of empowerment. Source: World Bank / ILOEST, 2025.
One especially useful distinction is participation versus the quality of opportunity. Country A can have a higher share of women economically active but far fewer women in secure salaried employment. Country B can have lower participation but a different formal-sector mix. Neither comparison alone gives programme designers a basis to conclude one country’s women are more empowered.
What paid and self-employment opportunities exist in accessible sectors and locations?
How do childcare, eldercare, transport and working-time constraints affect entry and retention?
Can women access training, assignments, sponsorship and promotion routes?
Do women have control over earnings, working conditions, enterprise decisions and safe participation?
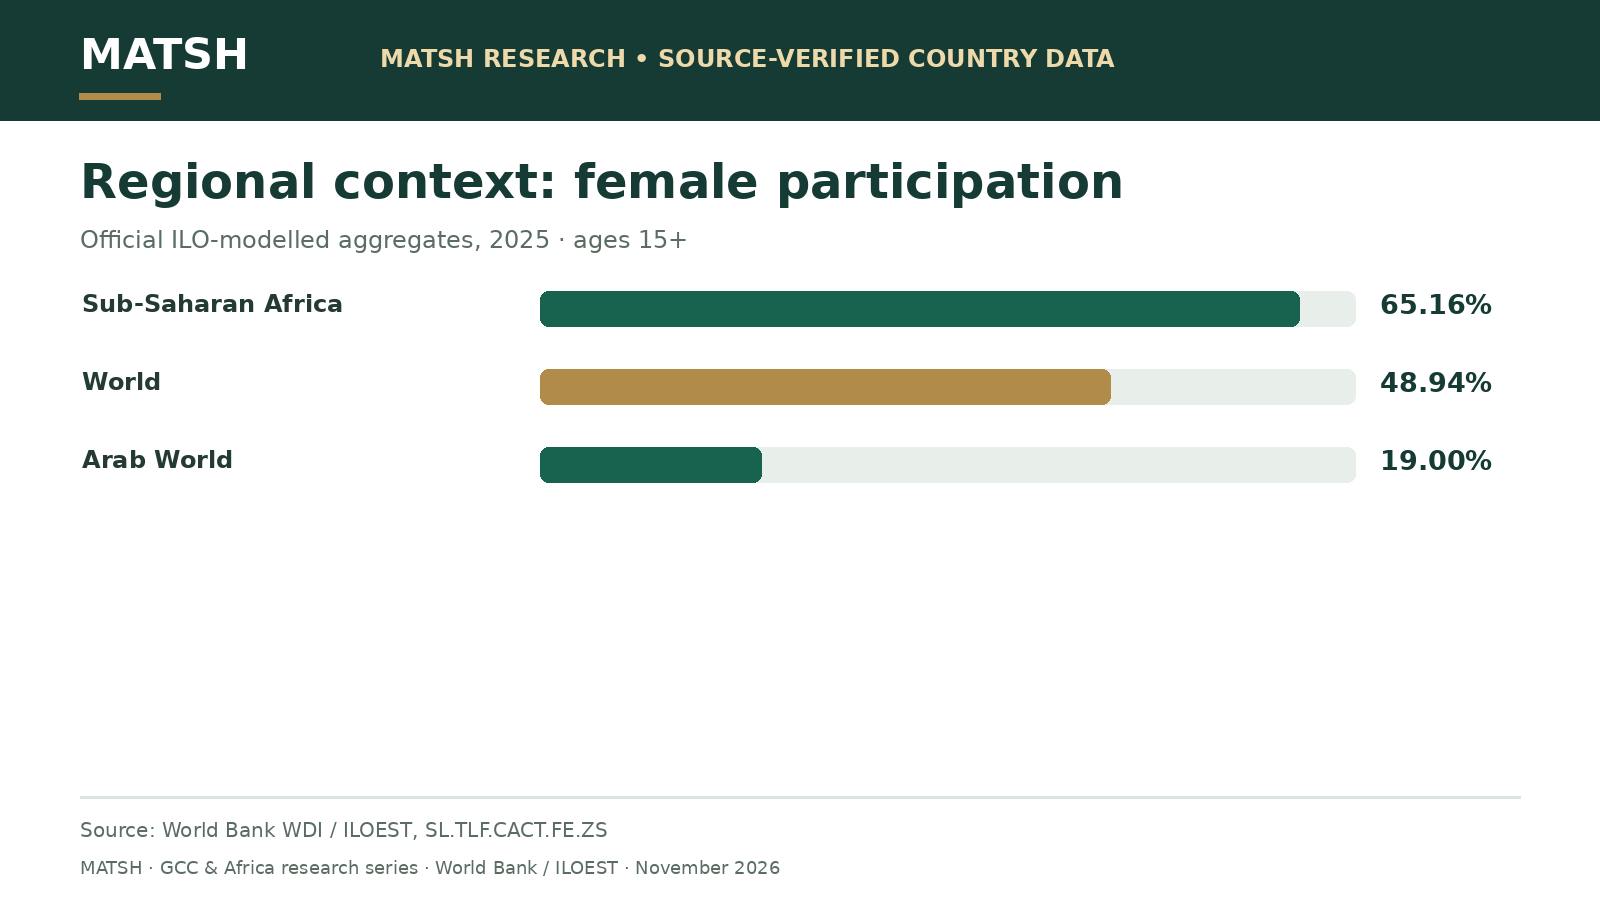
65.16%
48.94%
19.00%
These are World Bank geographic aggregates with their own membership; Arab World is not GCC, and Sub-Saharan Africa is not all Africa. Source: World Bank / ILOEST, 2025.
The World Bank reports 65.16% for Sub-Saharan Africa and 19.00% for the Arab World in this series, compared with 48.94% globally. The Arab World is not synonymous with GCC, and Sub-Saharan Africa excludes North Africa; therefore these are contextual aggregates rather than a two-region average of the countries in our tables. The difference should prompt questions about economic structures and definitions, not simplistic assertions about ambition or cultural attitudes.
Five metrics that complement workforce participation
Each complements the headline rate without replacing it. Women’s representation in senior and middle management is available as a separate World Bank indicator, SL.EMP.SMGT.FE.ZS, but the source does not provide an equally current complete set for all these GCC and African economies. Missing management observations should be displayed as missing rather than filled with invented values.
What policymakers, employers and programme teams can do with the evidence
For GCC ministries and employers
First specify the target population and denominator, including whether an initiative addresses citizens, residents or a particular age and qualification group. Second, connect national labour statistics with employer demand, work design, access to childcare and transport, career progression, and skills requirements. Third, separate an objective of increasing entry into work from an objective of increasing progression into managerial or specialist roles.
For African youth and women’s economic empowerment programmes
Diagnose labour demand and the quality of existing livelihoods before offering a generic training programme. Some participants need access to formal wage work, others need support for viable enterprises or safer, higher-productivity informal work. Data on care responsibilities, mobility and safety matter alongside skills. Programme success should be judged using income, stability and agency as appropriate to the intervention, not simply by whether a person crossed from outside to inside the labour force.
For businesses measuring internal progress
- Publish participation, hiring, retention and promotion indicators as distinct rates with definitions.
- Review wage progression and role distribution alongside overall female employee share.
- Compare cohorts consistently by occupation, level and working arrangement.
- Test whether sponsorship and leadership assignments are equitably accessible.
- Include qualitative feedback to understand barriers but do not present opinions as population prevalence.
- Assess programme outcomes against credible baselines and alternative explanations.
Questions for a stronger research brief
- Is the percentage based on women aged 15+ or a different age bracket?
- Does the source describe all resident women, national citizens only, or employed women?
- Is the number an annual ILO modelled estimate, a national labour-force survey or administrative reporting?
- Is the goal increased labour-force entry, better jobs, earnings, promotion or control over economic decisions?
- Can observed changes plausibly be attributed to the programme, or are only national associations available?
Original charts and graphics to share and cite
Each graphic is an independent, source-labelled MATSH visualisation. Open or save the full-resolution PNG, and credit MATSH for the design and World Bank WDI / ILOEST for the underlying data. Do not change the reference year, sample definition or caveats when sharing.
Methodology, country dataset and reuse
Download the 39-country 2025 female labour-force participation CSV. The file includes all six GCC countries, 33 selected African countries, values, reference year, indicator code and source URL. Percentages are kept to two decimal places as displayed by the World Bank. Country coverage is an editorial set, not a population-weighted African regional estimate.
Source: World Bank World Development Indicators, ILO Modelled Estimates (ILOEST), indicator SL.TLF.CACT.FE.ZS. Population: female resident population ages 15+. Unit: percent in labour force (employed plus unemployed). Reference year: 2025. Publication: compiled November 2026. Limitations: modelling revisions, varied national input data, labour-force definitions and the absence of job-quality or management-role measures. Reuse: World Bank page identifies CC BY 4.0; retain attribution and do not imply an original MATSH field survey.
Frequently asked questions
What is the difference between participation and employment?
Participation includes both employed and unemployed people who are in the labour force. Employment measures people who actually work.
What is Saudi Arabia’s female labour-force participation in this dataset?
The 2025 modelled all-resident figure is 33.57% for women aged 15+, not a citizens-only quarterly national figure.
Why do some African countries show higher percentages than GCC countries?
Participation reflects differences in economic activity and employment structures, including self-employment and informal work. The statistic alone cannot explain the causes or establish higher job quality.
Can we infer how many women are managers from participation data?
No. Management representation has a different denominator and must be sourced from an appropriate independent dataset.
Related MATSH resources
- Women’s Economic Empowerment Evidence 2026, on work, care, finance and legal opportunity.
- Women’s leadership development and the leadership pipeline.
- Women in Leadership Course.
Turn participation evidence into stronger workforce programmes
Build interventions around the specific barriers that data and local research demonstrate, then evaluate progression, retention and meaningful economic outcomes.
Women in LeadershipFemale Entrepreneurship SkillsDiscuss a tailored programme
Primary sources and disclosures
- World Bank WDI / ILOEST female labour force participation SL.TLF.CACT.FE.ZS.
- World Bank Arab World country breakdown, 2025.
- World Bank Sub-Saharan Africa country breakdown, 2025.
- World Bank indicator definition and metadata.
- ILOSTAT modelled estimates data description.
- World Bank separate women-in-management indicator.
Editorial country-data compilation, not a MATSH labour-force survey. No causal programme impacts are inferred. Draft pending original media, browser render, fact check and SEO metadata QA.