Complaint Analytics and Root Cause: How to Turn Complaints Into Service Improvement
November 20, 2026 · Research · 7 min read
Written by MATSH Research & Editorial Team · Last updated
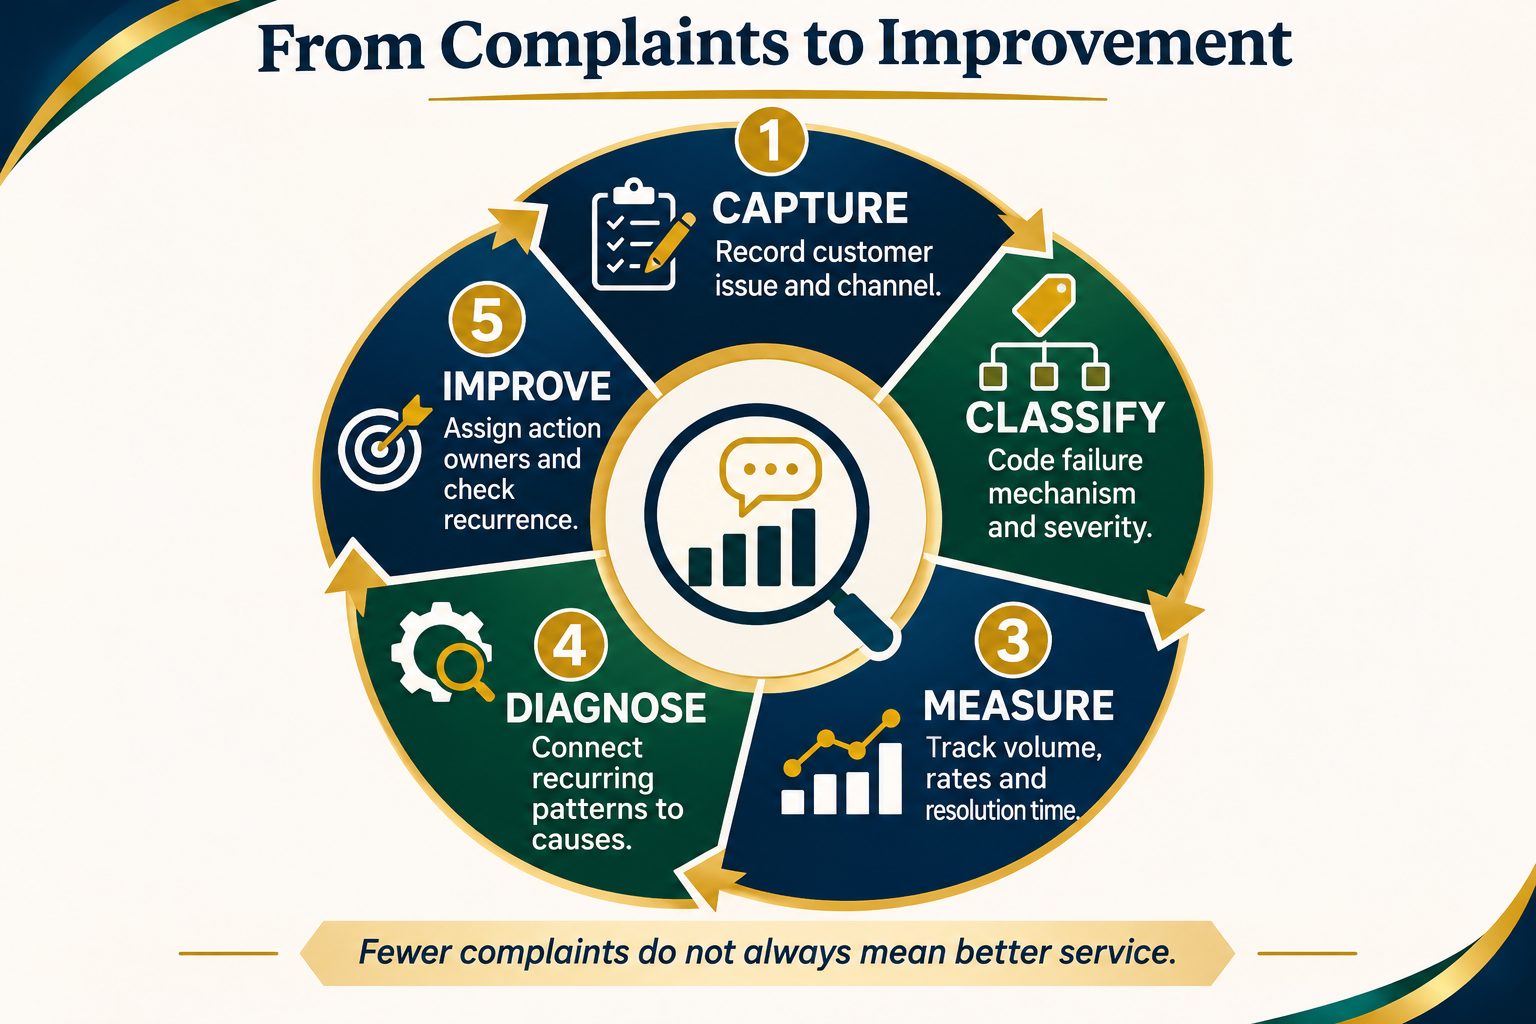
If the complaints team resolves the same failure every week, the organisation is managing customers but not improving the system.
Complaint analytics should identify where failures recur, how severe they are, which customer journeys are affected, what the underlying mechanism is and whether corrective action actually reduced recurrence. Counting cases is only the beginning.
ISO 10002:2018 explicitly includes analysing and evaluating complaints to improve products and services, auditing the complaint-handling process and reviewing its effectiveness and efficiency. ISO 10004:2018 sits alongside it as the current ISO guidance for monitoring and measuring customer satisfaction.
Source: ISO 10002:2018 · Source: ISO Customer Satisfaction Standards Catalogue

1. Build a complaint taxonomy that reflects failure mechanisms
| Level | Example |
|---|---|
| Journey | Ordering |
| Category | Delivery |
| Subcategory | Late delivery |
| Cause | Warehouse missed carrier cut-off |
| Contributing factor | Late replenishment |
2. Avoid categories based only on department names
“Operations complaint” says little about what failed. Categorise the customer problem and root cause separately from organisational ownership.
3. Use one primary complaint category
Cases can have multiple tags, but a primary category helps avoid double-counting total complaint volume.
4. Add severity
Minor inconvenience, easy correction.
Material customer impact or repeat contact.
Significant loss, safety, regulatory or major relationship impact.
Severe harm, legal/regulatory/reputational exposure.
5. Track volume and rate
| Measure | Why it matters |
|---|---|
| Complaint count | Total workload / issue volume |
| Complaints per 1,000 transactions | Normalises for business volume |
| Complaints per customer segment | Identifies uneven experience |
| Repeat complaints | Shows failed recovery or recurring issue |
6. Do not celebrate lower complaint volume automatically
Complaints fall 30% after channel redesign
Management celebrates until customer research shows the new complaint form is difficult to find and requires six mandatory fields.
Lower complaint volume reflected access friction, not service improvement.
7. Track accessibility and abandonment
Useful signals
- Form/contact abandonment
- Transfer rate
- Repeat contacts before ownership
- Channel availability
- Complaint intake errors
8. Measure acknowledgement and resolution separately
A complaint can be acknowledged quickly but remain unresolved for weeks. Track both.
9. Use ageing buckets
| Age | Management use |
|---|---|
| Within target | Normal flow |
| Approaching due | Prioritise before breach |
| Overdue | Escalate cause/owner |
| Long overdue | Senior review / systemic blockage |
10. Track first-contact resolution carefully
First-contact resolution is useful for simple issues but dangerous if staff close cases prematurely to improve the metric. Pair it with reopen/repeat-contact rates and quality review.
11. Measure transfer rate
Repeated transfers often indicate unclear ownership, weak authority or poor routing. Trend by complaint type and channel.
12. Track recovery cost
| Cost | Example |
|---|---|
| Direct remedy | Refund, replacement, credit |
| Service recovery labour | Handling/investigation time |
| Operational rework | Repeat delivery, repair, manual correction |
| Relationship impact | Churn/renewal risk where measurable |
13. Use Pareto analysis on recurring categories
Rank causes by volume, cost or severity. The highest-volume complaint may not be the highest-risk issue.
Monthly complaint Pareto
Late deliveries generate 42% of complaints, but billing errors generate the highest customer loss and regulatory exposure. Improvement priorities therefore consider both frequency and consequence.
14. Separate symptom from root cause
| Complaint | Symptom | Possible root cause |
|---|---|---|
| Wrong item | Picking error | Similar packaging + slotting + scan bypass |
| Long wait | Queue | Demand pattern + staffing + process bottleneck |
| Incorrect bill | Charge error | Pricing master-data / interface failure |
15. Trigger root-cause analysis by threshold
Trigger when:
- Issue repeats above threshold
- Severity is high even once
- Cost rises materially
- Regulatory/safety implication exists
- Previous corrective action failed
- Multiple channels report the same mechanism
16. Use complaint records with operational data
What the customer experienced.
What the process/system did.
What the failure cost.
What defect/control failed.
17. Link corrective action to a process owner
The complaints team should not own warehouse slotting, billing-system configuration or product design. Assign systemic actions to the function that controls the cause.
18. Define corrective-action evidence
| Action | Evidence |
|---|---|
| Change label design | New label deployed |
| Update system rule | Configuration/test evidence |
| Train team | Training plus observed behaviour |
| Redesign process | New workflow + performance result |
19. Measure recurrence after the action
Do not close a systemic complaint action when the document or training is issued. Close when evidence shows the cause is controlled or the residual risk is accepted.
20. Track reopen rate
Cases reopened because the customer disagrees, promised action did not occur or the issue returned are powerful signals of poor resolution quality.
21. Use sample quality reviews
Score sample cases on:
- Issue correctly understood
- Evidence sufficient
- Decision consistent
- Remedy proportionate
- Tone clear/respectful
- Escalation appropriate
- Root cause/category coded accurately
- Promised action completed
22. Avoid KPI gaming
| KPI | Gaming risk |
|---|---|
| Fast closure | Premature closure |
| Low compensation | Under-remediation |
| Low complaint volume | Hard-to-access complaint process |
| High FCR | Avoiding necessary escalation |
23. Use a balanced complaint scorecard
Can customers complain easily?
Acknowledgement/resolution age.
Case-review score, reopen rate.
Severity, regulatory/safety cases.
Root-cause actions and recurrence.
24. Segment complaints by journey
Product categories alone may hide a broken handoff. Map complaints to acquisition, onboarding, delivery, billing, service, renewal or cancellation.
25. Use complaint trends with customer satisfaction data
ISO 10004 covers monitoring and measurement of customer satisfaction. Complaint data is one input. Pair it with broader feedback, because many dissatisfied customers never complain.
26. Review high-severity cases individually
A Pareto chart can hide one severe event. Maintain executive review for critical safety, regulatory, fraud or reputational complaints regardless of frequency.
27. Report systemic issues with business impact
| Issue | Evidence |
|---|---|
| Cause | Process/system failure |
| Frequency | Cases / rate |
| Impact | Customer, cost, risk |
| Owner | Function controlling cause |
| Action | Corrective plan |
| Result | Recurrence after action |
28. Audit the complaint system itself
Audit questions
- Can customers access the process?
- Are owners/authority clear?
- Are decisions evidence-based?
- Are high-risk complaints escalated?
- Are records complete?
- Do systemic actions close?
- Do repeat failures decline?
29. Use complaint learning in service design
Complaint trends should feed product, operations, policy, training and journey redesign. The complaints team is an intelligence function as well as a resolution function.
Common complaint-analytics mistakes
30. Use denominator discipline
A complaint rate requires a denominator that matches the service. Compare complaints per order, flight, account, visit, claim or another meaningful unit rather than mixing unlike activity.
| Business | Possible denominator |
|---|---|
| E-commerce | Orders / deliveries |
| Banking | Active accounts / transactions |
| Hospitality | Stays / occupied room nights |
| Contact centre | Contacts / cases handled |
31. Separate complaint incidence from reporting propensity
Two customer groups can experience the same failure but complain at different rates. Use surveys, operational defect data and other feedback alongside complaint counts when estimating broader customer impact.
32. Use cohort analysis after process changes
| Cohort | Question |
|---|---|
| Before change | What was the baseline complaint rate/cause? |
| Immediately after | Did the change introduce new failure? |
| Stabilised period | Did recurrence remain lower? |
33. Link complaint causes to process steps
For each recurring cause, record:
- Customer journey step
- Internal process step
- System / team owner
- Control expected
- Failure mechanism
- Corrective action
- Evidence of effectiveness
34. Use severity-weighted trend views
A month with fewer complaints can still be worse if the remaining complaints are more serious. Create separate views for total volume, high-severity cases and total recovery cost.
35. Use repeat-cause heat maps
Cross complaint cause with product, location, channel or supplier. This can reveal a concentrated failure hidden inside enterprise totals.
Billing complaints look moderate overall
Enterprise rate is stable, but one new mobile-app release produces a sixfold increase in duplicate-charge complaints. A heat map by channel/version surfaces the issue immediately.
36. Track corrective-action ageing
| Status | Meaning |
|---|---|
| Open | Action assigned but not implemented. |
| Implemented | Change delivered, effectiveness not yet proven. |
| Verified | Evidence shows recurrence/risk reduced. |
| Closed | Residual risk accepted and learning captured. |
37. Distinguish corrective action from containment
Refunding customers and manually correcting bills contains the immediate issue. Fixing the pricing interface prevents recurrence. Track both so temporary workarounds do not masquerade as root-cause resolution.
38. Use complaint economics carefully
Possible costs
- Refunds/credits
- Repeat delivery/rework
- Handling labour
- Expedited service
- Regulatory or contractual cost
- Churn / lost renewal where evidence supports it
39. Review complaint themes with process owners
The complaints team should facilitate evidence, not become the owner of every action. Monthly reviews should include the functions that control the root causes.
40. Build a management-review pack
| Section | Decision |
|---|---|
| Volume/rate | Where is dissatisfaction increasing? |
| Severity | Which risks require immediate control? |
| Root causes | What mechanisms recur? |
| Corrective actions | What is overdue or ineffective? |
| Customer impact | What recovery/churn risk exists? |
| System quality | Is complaint handling itself effective? |
41. Audit coding consistency
If two analysts classify the same complaint differently, trend data is unreliable. Use category definitions, examples and calibration samples.
42. Retire categories that no longer help decisions
Complaint taxonomies grow over time. Remove obsolete or overlapping categories and preserve mapping so historical trends remain interpretable.
Use complaints as operational evidence, not just customer-service workload
MATSH’s Customer Complaint Handling and Service Recovery Course covers complaint taxonomy, severity, KPIs, root cause, corrective action, case quality and continuous improvement.
Explore Sales, Customer Relations & Negotiation
Explore the Complaint Handling course
Register
Sources
Need In-House Training?
We run all our courses as private programmes for organisations across the GCC and Africa.
Request In-House →