
How common is formal employee training among surveyed businesses?
A reference table of World Bank Enterprise Survey results, with survey years, 29 country records and evidence-based guidance for employers, training institutions and policy teams. This is a firm-level indicator, not an estimate of employees trained.
Compiled: November 2026 · Latest available survey per country · Indicator: IC.FRM.TRNG.ZS
Corporate training is frequently discussed as though it can be measured by one convenient headline, such as training expenditure per employee or the percentage of workers who took a course. Those are useful measures, but they are not the same as the World Bank’s share of firms offering formal training programmes to permanent, full-time employees. This report keeps the measurement narrow, states survey coverage and year, and makes the country data reusable.
These are country-level survey indicators with different collection years, not a synchronous 2025 comparison or evidence that a particular training policy caused the difference. Source: World Bank Enterprise Surveys.
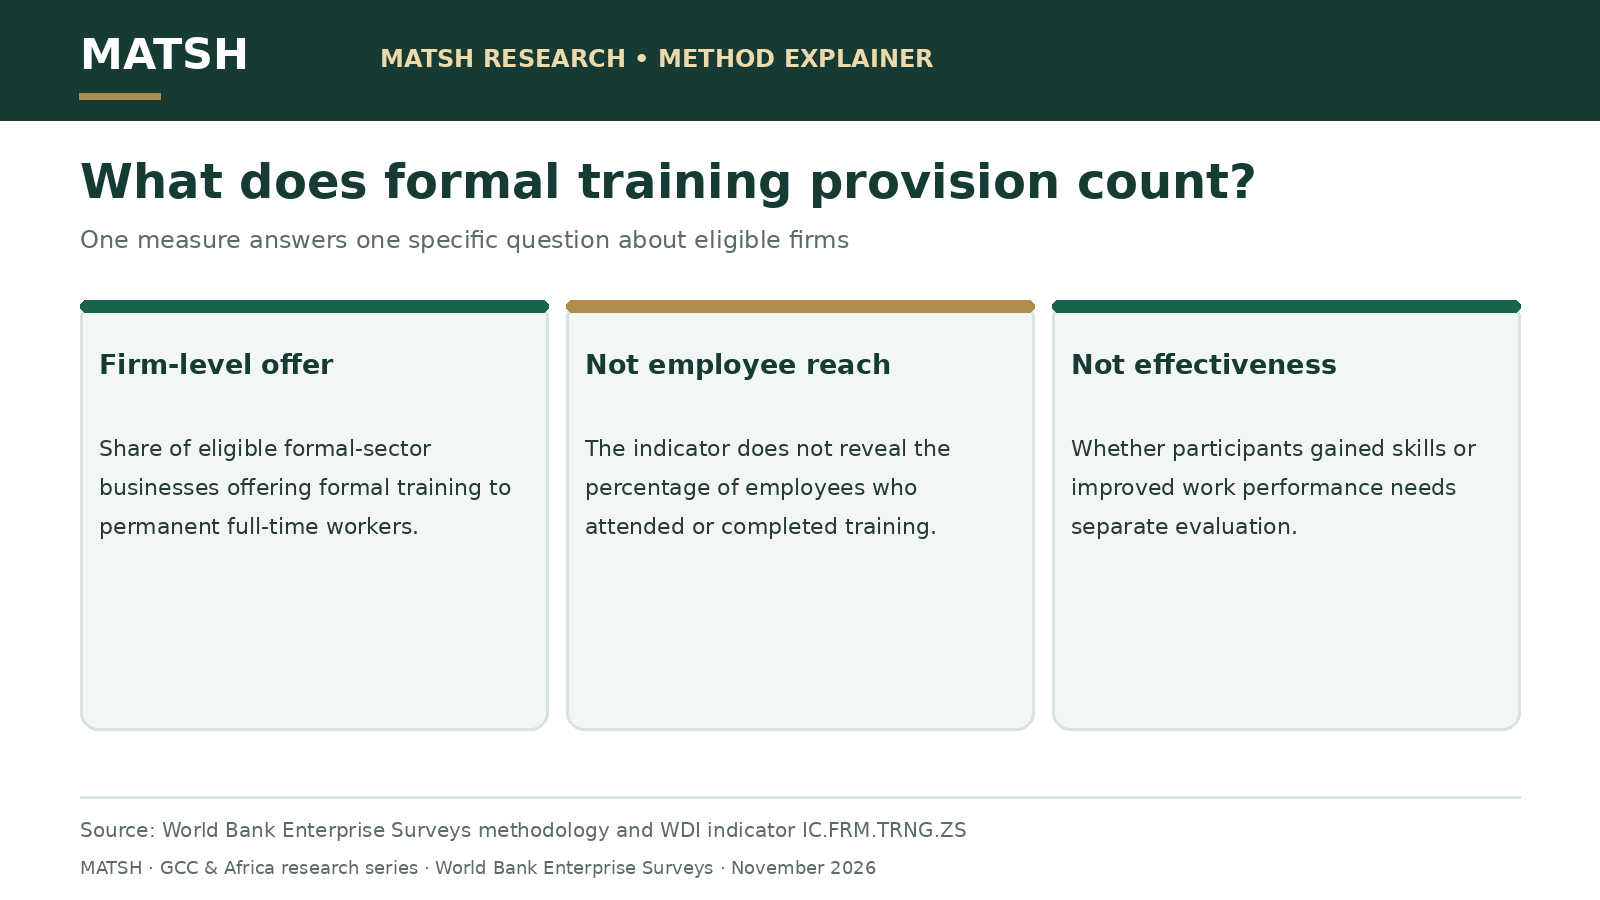
What exactly is counted as a firm offering formal training?
The World Bank defines this indicator as the percentage of firms offering formal training programmes for permanent, full-time employees. A manager’s informal coaching conversation, compulsory induction, accredited external qualification, and structured in-house learning are not automatically interchangeable survey responses. Without examining the questionnaire, readers should not infer which training formats or hours a respondent counted.
The Enterprise Surveys programme targets the eligible formal non-agricultural private sector. The global methodology generally covers registered establishments with at least five workers, more than zero private ownership, and specified manufacturing and service sectors. It uses stratified random samples by firm size, sector and location and interviews business owners or management representatives. See the official Enterprise Surveys methodology.
Percentage of surveyed eligible firms offering a formal training programme. The unit is a firm or establishment, not a person.
Covered registered private firms in specified sectors and size categories, not every microbusiness, government entity, NGO or informal enterprise.
Training intensity, quality, employee reach, hours, job performance, investment, certification or return on learning.
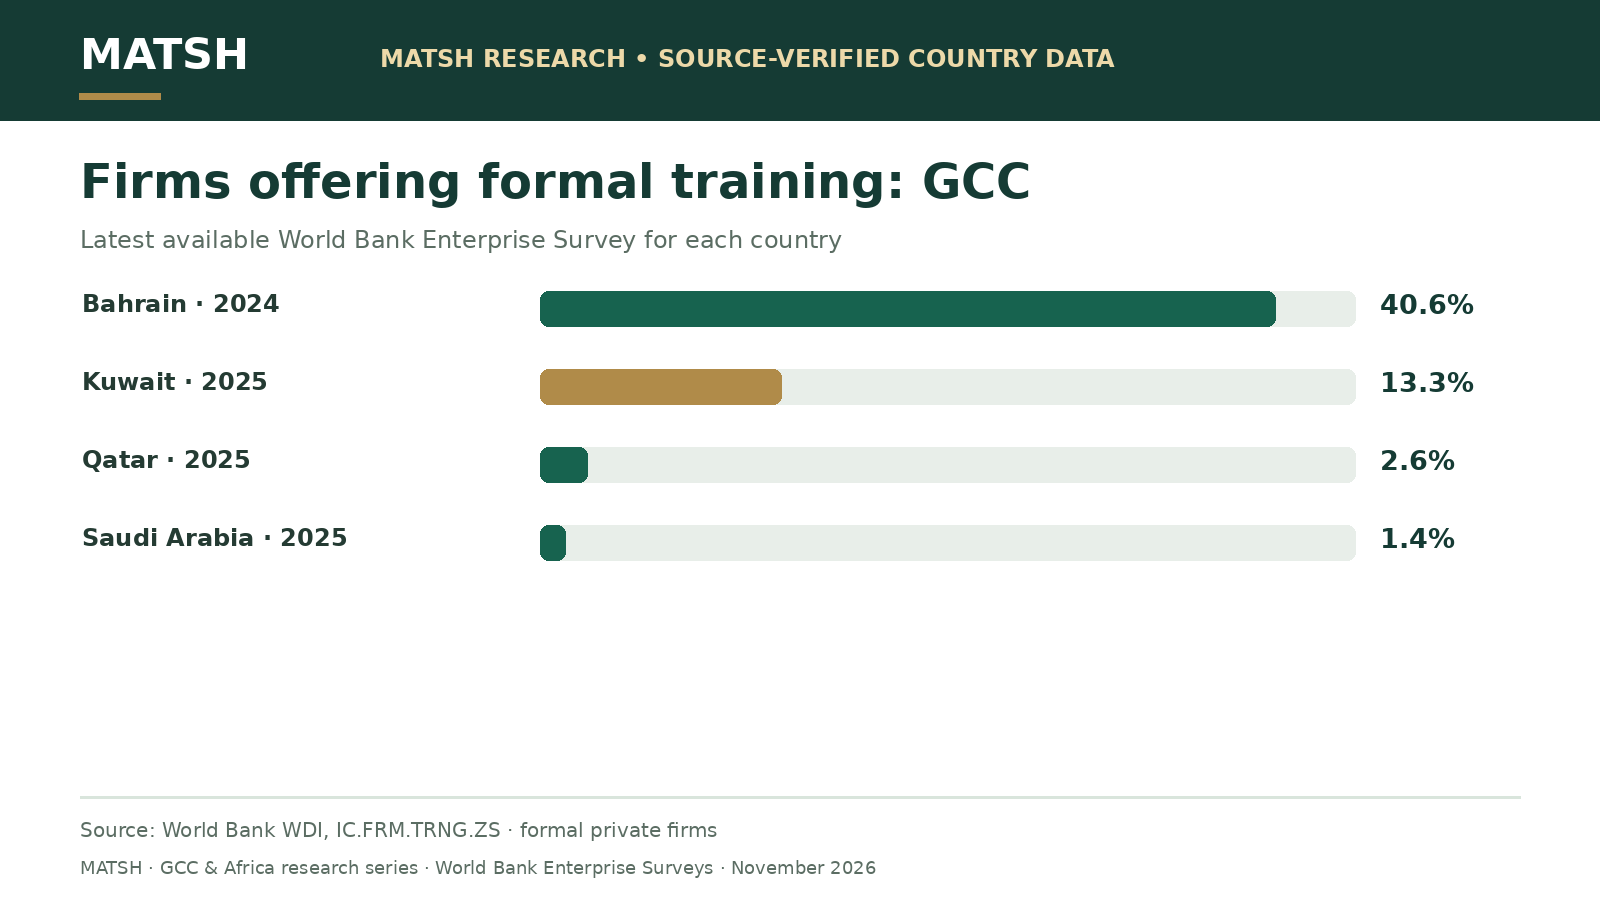
GCC firm-training statistics: latest available surveys
The current World Bank indicator reports values for Bahrain, Kuwait, Qatar and Saudi Arabia. UAE and Oman have no latest value displayed in this series at the time of this compilation. Blank does not mean zero; it means the table cannot substantiate a comparable figure. A full six-country GCC comparison must display the missing entries plainly.
40.6%
13.3%
2.6%
1.4%
Different survey years. Do not infer a single-year regional trend or cross-country causal explanation. Source: World Bank Enterprise Surveys / WDI.
| Country | Firms offering formal training | Latest survey year |
|---|---|---|
| Bahrain | 40.6% | 2024 |
| Kuwait | 13.3% | 2025 |
| Qatar | 2.6% | 2025 |
| Saudi Arabia | 1.4% | 2025 |
Saudi Arabia’s 1.4% is especially easy to misrepresent. This is the WDI value from the Saudi Arabia 2025 World Bank Enterprise Survey covering the formal private establishments described in its documentation; fieldwork ran from March 2025 to February 2026. It is not a national measurement of all employee learning, government training, classroom participation or the statutory training activity of every organisation. Before using the figure in a policy claim, review the survey instrument, sector and size breakdowns, weighting and sample precision.
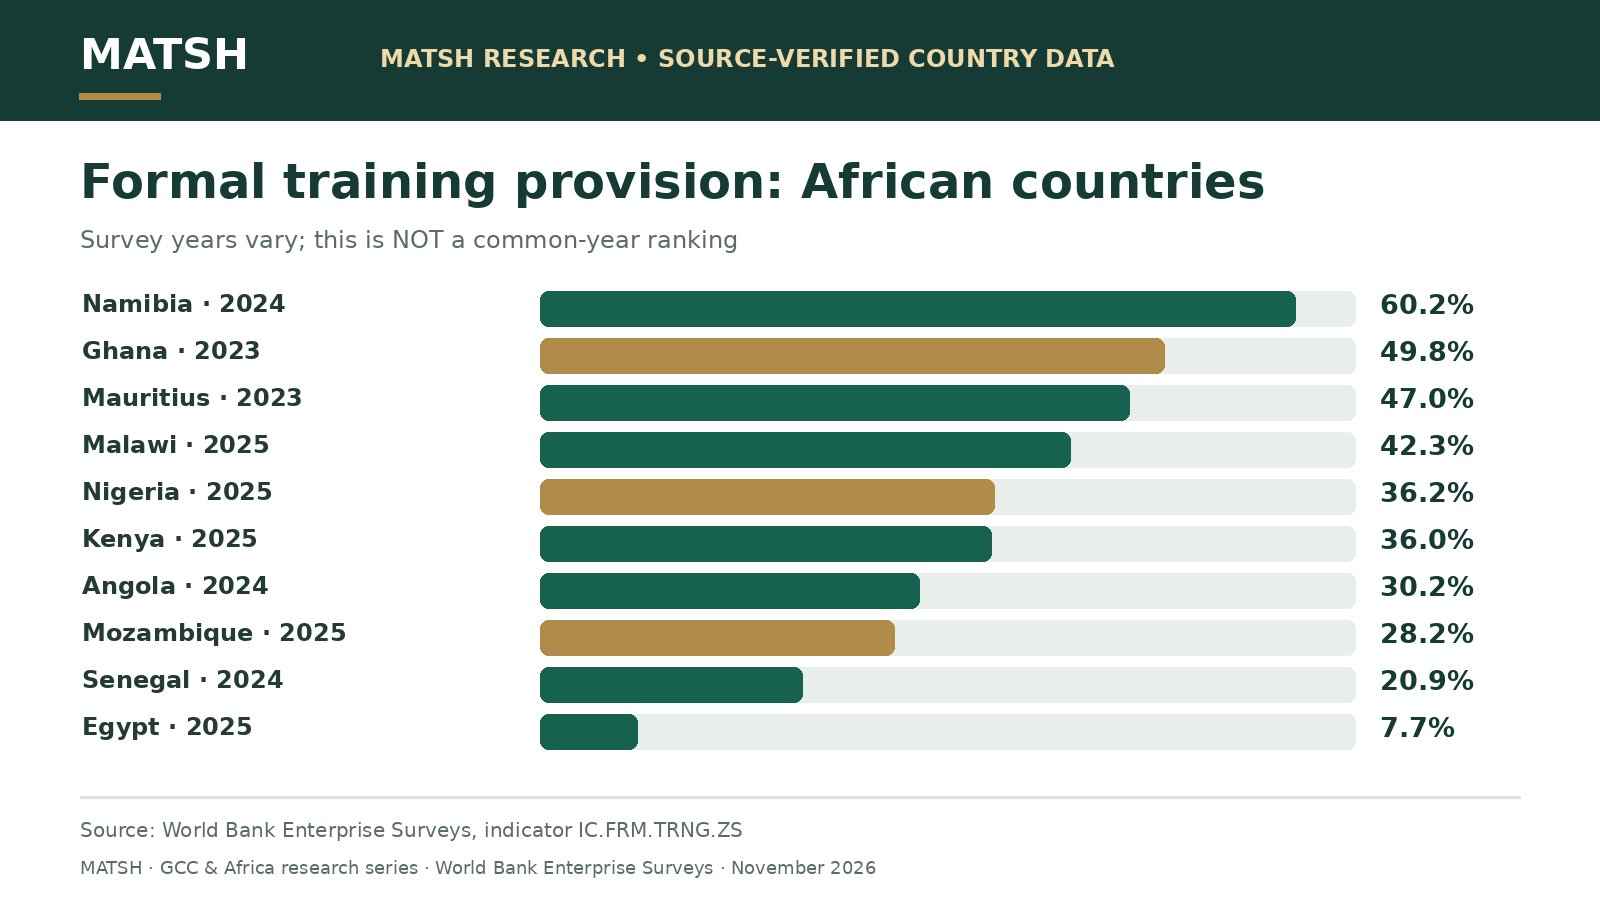
African company-training figures, with source year attached
The African records are from different survey rounds. Ghana’s 49.8% corresponds to 2023 while Kenya’s 36.0% and Nigeria’s 36.2% correspond to 2025. South Africa’s displayed 7.9% is from 2020. Presenting these as a single 2025 league table would be misleading.
60.2%
49.8%
47.0%
42.3%
36.2%
36.0%
34.6%
30.2%
28.2%
27.4%
26.7%
26.0%
Country survey years vary. This is a sorted view of the included data, not an index of training-system quality. Source: World Bank Enterprise Surveys / WDI.
7.7%
7.9%
8.8%
8.8%
12.0%
19.4%
20.0%
20.9%
23.6%
24.0%
24.5%
25.6%
Different survey populations and years; low values do not establish poor training outcomes. Source: World Bank Enterprise Surveys / WDI.
| Country | Firms offering formal training | Latest survey year |
|---|---|---|
| Angola | 30.2% | 2024 |
| Benin | 19.4% | 2024 |
| Botswana | 34.6% | 2023 |
| Burkina Faso | 12.0% | 2024 |
| Cameroon | 24.0% | 2024 |
| Egypt | 7.7% | 2025 |
| Ethiopia | 8.8% | 2025 |
| Ghana | 49.8% | 2023 |
| Kenya | 36.0% | 2025 |
| Malawi | 42.3% | 2025 |
| Mauritania | 25.6% | 2025 |
| Mauritius | 47.0% | 2023 |
| Morocco | 8.8% | 2023 |
| Mozambique | 28.2% | 2025 |
| Namibia | 60.2% | 2024 |
| Niger | 25.6% | 2025 |
| Nigeria | 36.2% | 2025 |
| Rwanda | 27.4% | 2023 |
| Senegal | 20.9% | 2024 |
| South Africa | 7.9% | 2020 |
| Tanzania | 20.0% | 2023 |
| Tunisia | 26.7% | 2024 |
| Uganda | 24.5% | 2025 |
| Zambia | 26.0% | 2025 |
| Zimbabwe | 23.6% | 2025 |
One cross-country result can hide considerable variation by enterprise size. Larger companies may have dedicated training departments, while smaller eligible firms may rely on informal mentoring or supplier-led instruction. A fuller country investigation should examine WBES firm-size and industry strata instead of automatically treating the national percentage as the experience of every business.
How to interpret gaps without producing false conclusions
Ghana 2023 and Saudi Arabia 2025 cannot be treated as observations of the same economic moment.
The covered manufacturing and service industries, and their share of the firm universe, can differ by economy.
Registered firms with at least five workers are not representative of every enterprise, especially where informal work is widespread.
Point estimates have sampling uncertainty. A small numerical gap is not automatically a meaningful statistical difference.
A company can report offering training while only a small proportion of its staff receive it, and vice versa under a different learning definition.
The presence of formal training says nothing, by itself, about retention, promotion, skills transfer or productivity.
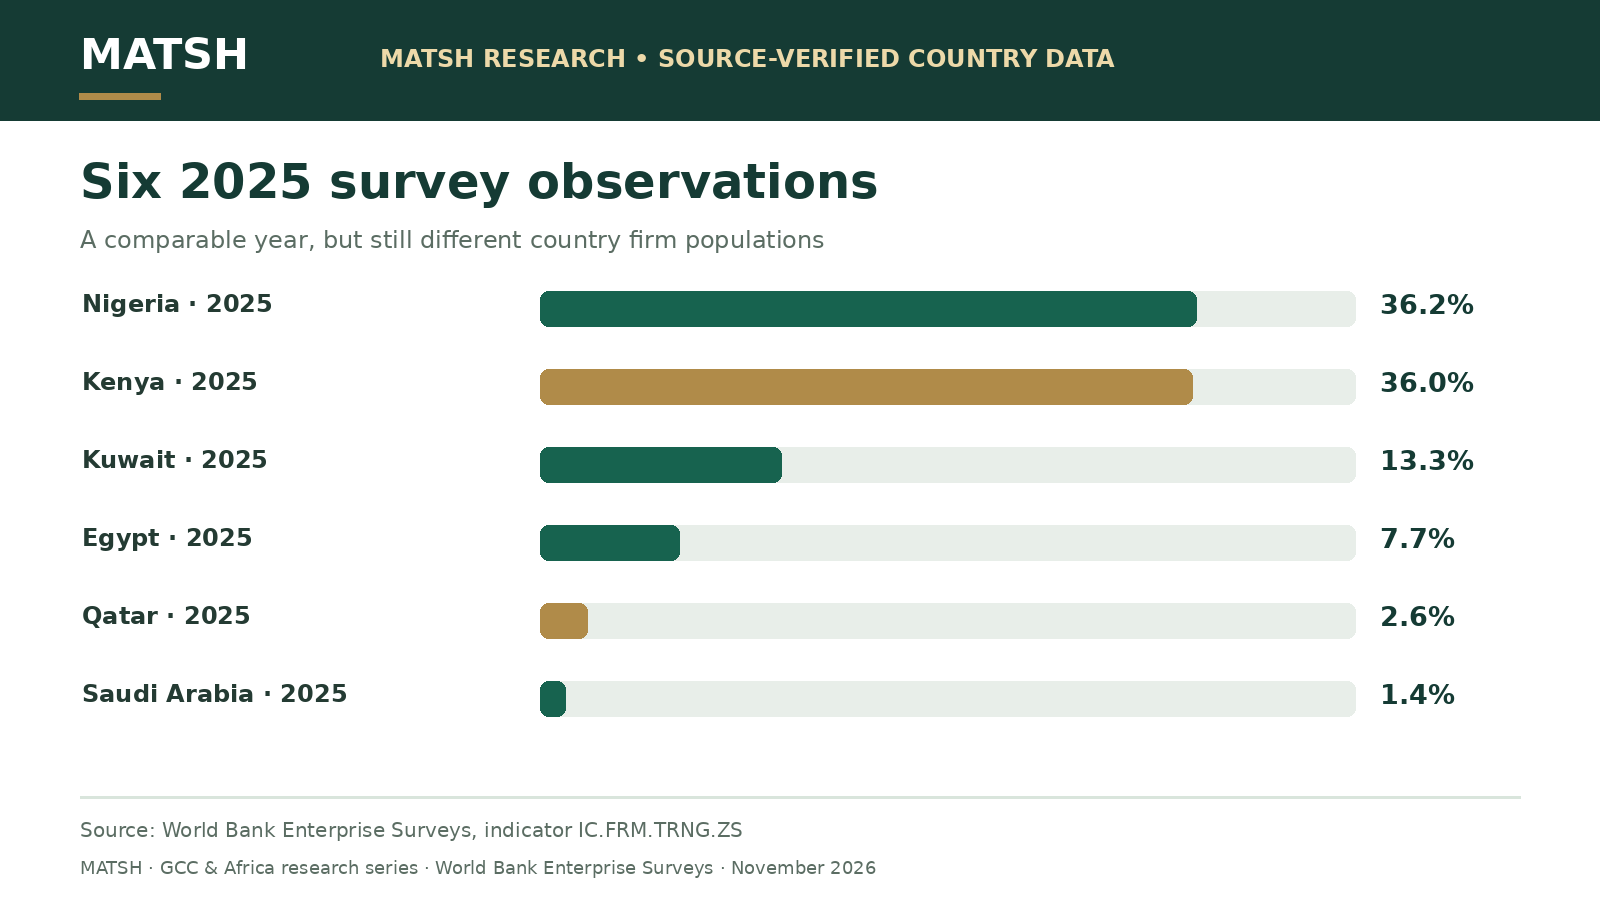
1.4%
2.6%
13.3%
40.6%
36.0%
36.2%
49.8%
A country-by-country reference, not a time trend or a training market-size estimate. Source: World Bank Enterprise Surveys / WDI.
What about survey-based regional averages?
It would be incorrect to average the entries in this article and label the answer the GCC training rate or African training rate. The 29 records are a purposive set of countries with different surveys and firm populations, not a regionally representative sample. World Bank regional aggregates use their own methodology and eligible country data. A simple mean here would only describe the selected rows.
Why the number might diverge from reports on workplace learning
Labour force surveys may ask employees whether their employer has provided training, whereas Enterprise Surveys ask businesses whether they offer a formal programme. Administrative reports may count completed training hours, enrolled workers or reimbursed courses. These sources differ in respondent, sample, definition and recall period. Even within one country they can yield markedly different percentages without either being necessarily erroneous.
What employers and training providers should measure instead of a single headline
Benchmarking the presence of formal training is useful, but operational decisions need a fuller measurement system. Begin with a clear organisational problem such as errors, delays, retention, supervisory capability or compliance. Then select learning objectives and a delivery model tied to observable work behaviour.
Useful measures for a corporate learning dashboard
- Percentage of employees who had access to formal training, and percentage who participated, with separate denominators.
- Training hours per eligible employee, delivery type, and direct costs by learning pathway.
- Job-role, location and gender participation gaps, subject to privacy protections.
- Pre- and post-training assessment on tasks directly relevant to the programme.
- Learning transfer at 30, 60 and 90 days through evidence from managers and work samples.
- Operational indicators linked to the original performance problem, with confounding factors documented.
These measures answer different questions. A formal training programme may be widespread yet ineffective; a smaller, targeted programme may deliver measurable value. World Bank survey coverage helps frame the market landscape but cannot substitute for internal learning evaluation.
Five questions to ask before citing a corporate-training percentage
- Is the denominator a firm, an establishment, an employee, a training session or a budget?
- Does it cover formal registered businesses only, or also government, microenterprises and informal operations?
- Which country, survey year, sectors, firm sizes and locations were sampled?
- Does the figure describe offering, attending, completing or successfully applying training?
- Has the original study published confidence intervals, breaks or sampling notes that change the interpretation?
Original charts and graphics to share and cite
Each graphic is an independent, source-labelled MATSH visualisation. Open or save the full-resolution PNG, and credit MATSH for the design and World Bank Enterprise Surveys for the underlying data. Do not change the reference year, sample definition or caveats when sharing.
Data download and methodology
Download the 29-row country, survey-year and indicator CSV. It contains four GCC markets and 25 African country records, source links and exact latest available years shown by World Bank WDI when compiled.
Metric: IC.FRM.TRNG.ZS, percentage of eligible firms providing formal training to permanent full-time workers. Year: country-specific most recent survey in the source, not a common 2025 observation. Geography: included GCC and African countries with a visible country value; missing countries are not assigned zeros. Selection: editorial geographic coverage, not a representative regional sample. Figures: rounded to one decimal place as displayed in WDI. Data attribution: World Bank Enterprise Surveys, CC BY 4.0 as shown by World Bank WDI.
Frequently asked questions
What percentage of Saudi companies offer formal employee training?
The World Bank’s displayed 2025 Enterprise Survey indicator for its eligible formal private establishment population is 1.4%. This is not a measure of every employer, training hour or Saudi worker.
Does Bahrain train more employees than Saudi Arabia?
The indicator cannot establish that. Bahrain’s 40.6% is a 2024 firm-level formal training offer measure; Saudi Arabia’s 1.4% is a 2025 firm-level formal training offer measure. Neither is the proportion of employees trained.
Why are some GCC countries missing?
The WDI series does not display a most-recent indicator value for UAE or Oman in this compilation. Missing is not zero.
Can a country-level training figure predict course demand?
No. Course demand also depends on purchasing, job needs, workforce size, employment rules, employer budgets and awareness. The Enterprise Survey measure alone is insufficient.
Related MATSH learning resources
For programme design, link training provision to actual workplace capability and outcomes. See Change Management for Leaders and Managers and Advanced Administration Skills.
Design workplace training around measurable capability gaps
Identify the performance need, choose suitable delivery and assess transfer into daily work. MATSH offers instructor-led programmes and customised in-house learning for organisations in the GCC and Africa.
Primary sources
- World Bank WDI, firms offering formal training (IC.FRM.TRNG.ZS).
- World Bank data definition, sampling and periodicity metadata.
- World Bank Enterprise Surveys formal-sector methodology.
- Saudi Arabia, World Bank Enterprise Survey 2025 dataset description.
- Enterprise Surveys coverage and inclusion FAQ.
This article does not claim MATSH surveyed firms or produced the original World Bank estimates. Country data should be refreshed when survey rounds are replaced. Draft pending independent media, browser, SEO and downloadable-file QA.