
Youth NEET rates: where young people are outside work, education and training
A country-by-country 2025 reference table for all six GCC countries and 51 African economies, with modelled ILO estimates, the distinction from youth unemployment, and practical guidance for programme designers. Source figures can be checked and reused with attribution.
Data period: 2025 · Compiled: November 2026 · Indicator: SL.UEM.NEET.ME.ZS · Population: ages 15–24
A youth employment programme can report falling unemployment while still failing to reach young people who are out of school, out of training and not looking for work. That is why the share of youth not in employment, education or training, known as the NEET rate, is often a more useful starting point for diagnosing exclusion. This report focuses on a specific statistical question rather than repeating MATSH’s separate youth unemployment research.
All four figures above use the 2025 World Bank WDI series based on ILO modelled estimates. The regional and global aggregates are population-weighted official series, not means of the countries in the tables below.
What the NEET rate measures, and what it does not
NEET is a share of all people aged 15–24, not just the young people who are in the labour force. Someone may be counted as NEET because they are looking for work, because they are discouraged from looking, because care responsibilities prevent participation, because they face health or access constraints, or for other reasons. A NEET figure alone cannot distinguish these circumstances. Some are temporary; others signal persistent exclusion.
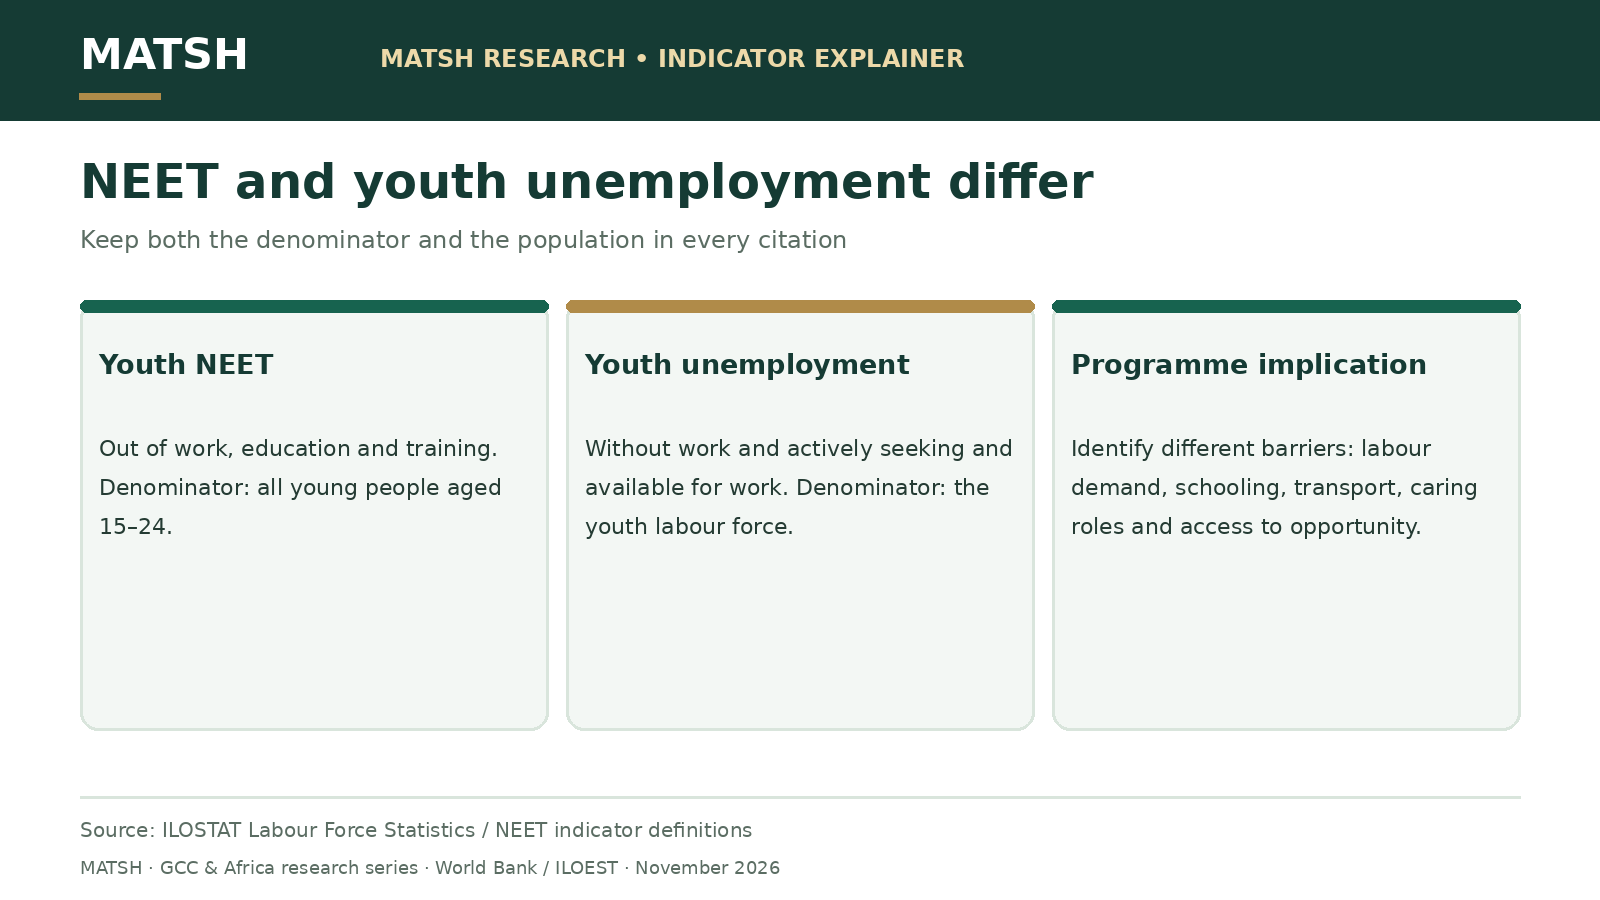
All young people aged 15–24. It includes unemployed non-students and young people outside the labour force who are not studying or training.
Economically active young people aged 15–24. It does not include most young people who are outside the labour force.
It does not reveal motivation, employability, income, aspirations, causes of exclusion, or whether one specific training intervention is effective.
The ILOSTAT methodology defines the rate using employment and participation in education or training and explains how overlapping statuses are handled. A national statistical release may use different sampling, definitions, or reference periods. MATSH therefore uses one consistent ILO-modelled series for its headline comparison and treats national estimates separately.
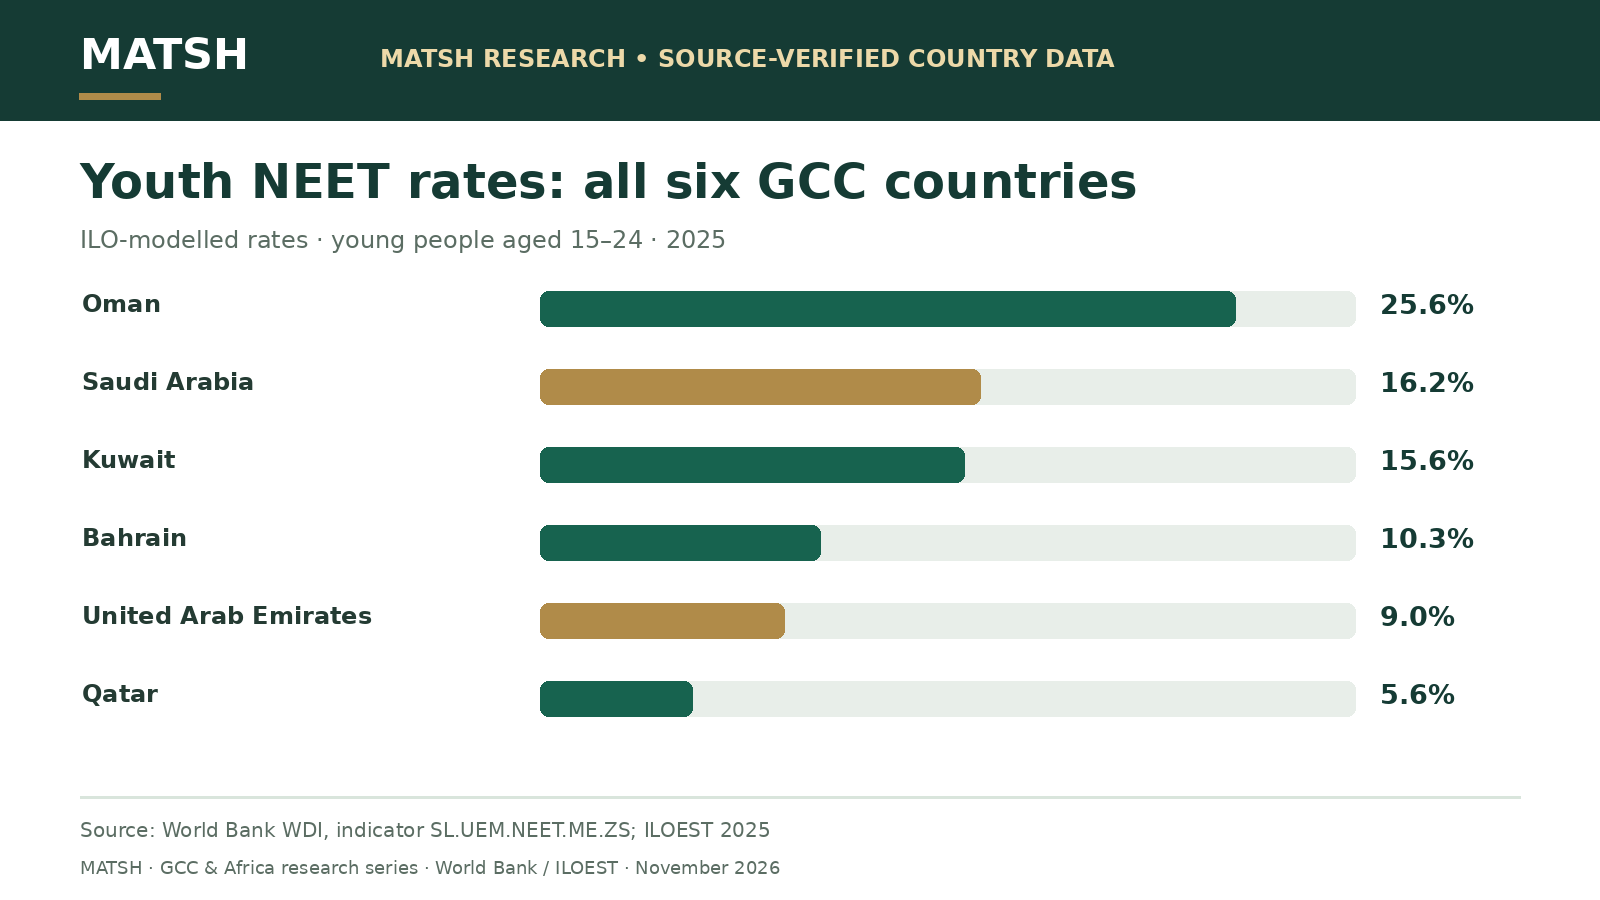
GCC youth NEET rates in 2025: all six countries
The six GCC economies do not form a single labour market. Their modelled 2025 rates run from Qatar at 5.6% to Oman at 25.6%. Citizenship, age composition, education, labour supply, and migration patterns matter when interpreting an all-resident estimate.
25.6%
16.2%
15.6%
10.3%
9.0%
5.6%
Rates show all-resident youth aged 15–24; not citizen-only unemployment. Source: World Bank / ILOEST, 2025.
| Country | Youth NEET rate | Reference year |
|---|---|---|
| Bahrain | 10.3% | 2025 |
| Kuwait | 15.6% | 2025 |
| Oman | 25.6% | 2025 |
| Qatar | 5.6% | 2025 |
| Saudi Arabia | 16.2% | 2025 |
| United Arab Emirates | 9.0% | 2025 |
Saudi Arabia’s 16.2% modelled estimate should not be substituted for a national rate reported on a different basis. The UAE’s modelled 9.0% likewise does not say how many Emirati nationals are NEET. Policymakers working with citizens, expatriates or particular emirates need matching administrative or survey denominators rather than directly treating this cross-country table as a programme target.
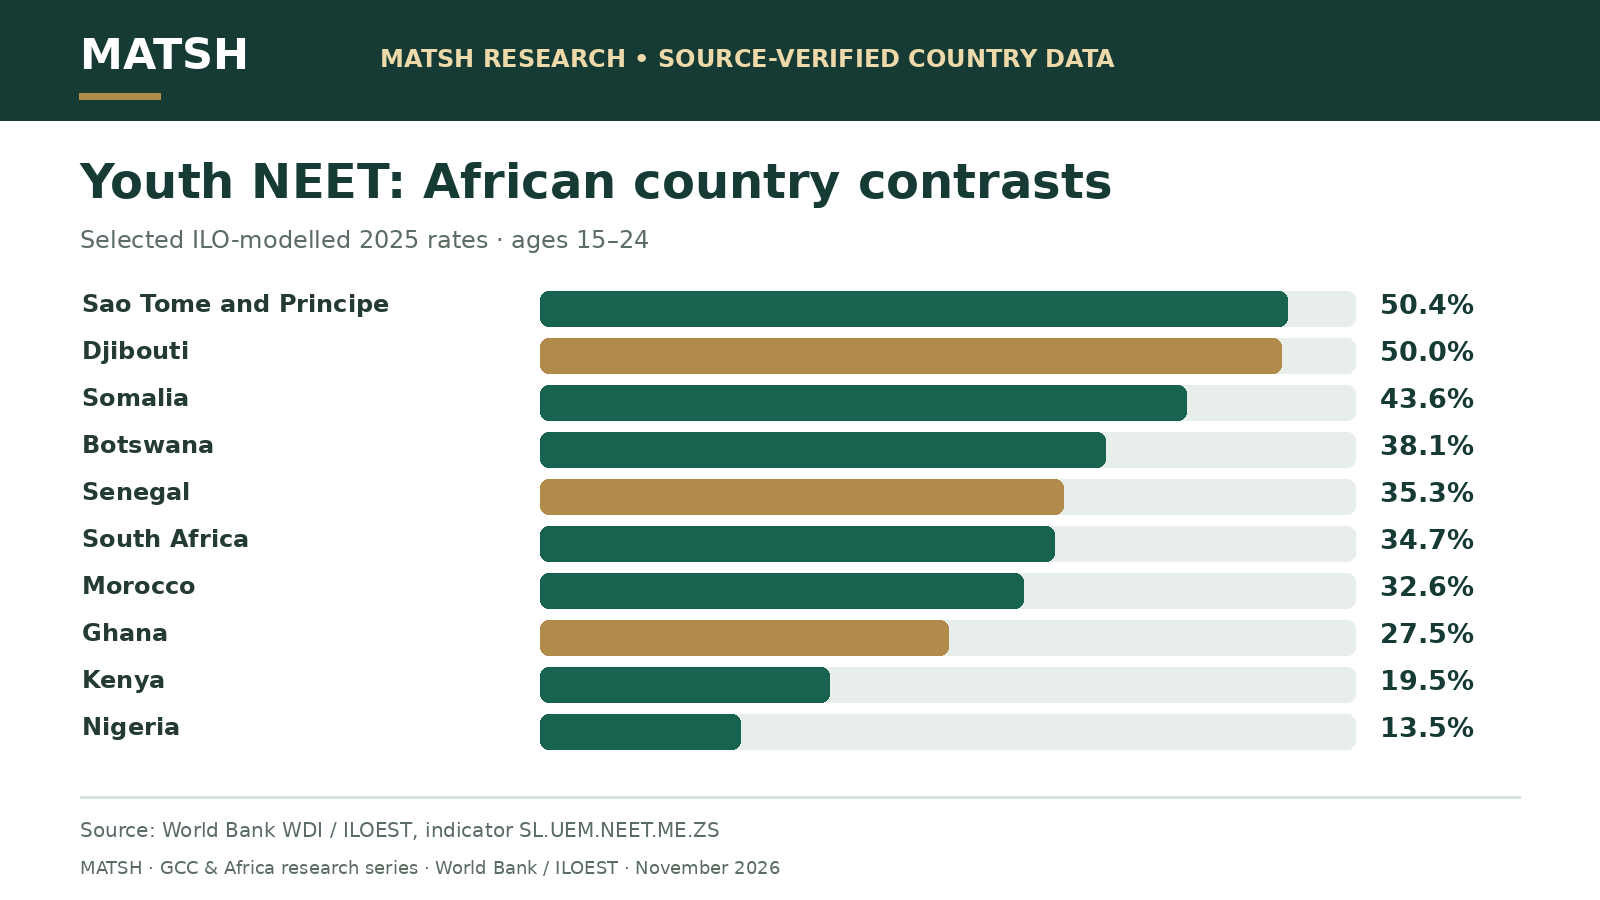
African youth NEET rates: country table and contrasts
Africa is not one labour market. The same headline statistic spans economies with very different labour-force structures, education access, informal work, migration, and programme reach. The country table below is best used to identify questions for further local research, not to award rankings for programme success.
50.4%
50.0%
43.6%
39.8%
38.1%
38.1%
37.7%
36.7%
36.7%
35.3%
This is a within-table sorting of modelled country figures, not a ranking of policy quality. Source: World Bank / ILOEST, 2025.
11.1%
12.8%
13.1%
13.3%
13.5%
13.6%
14.4%
14.8%
16.1%
17.2%
A low NEET rate is not proof of decent wages, productivity or secure jobs. Source: World Bank / ILOEST, 2025.
| Country | Youth NEET rate | Reference year |
|---|---|---|
| Algeria | 19.7% | 2025 |
| Angola | 24.8% | 2025 |
| Benin | 14.4% | 2025 |
| Botswana | 38.1% | 2025 |
| Burkina Faso | 24.9% | 2025 |
| Burundi | 12.8% | 2025 |
| Cabo Verde | 28.2% | 2025 |
| Cameroon | 23.2% | 2025 |
| Central African Republic | 29.9% | 2025 |
| Chad | 37.7% | 2025 |
| Comoros | 21.3% | 2025 |
| Congo, Dem. Rep. | 30.1% | 2025 |
| Congo, Rep. | 29.4% | 2025 |
| Cote d’Ivoire | 19.1% | 2025 |
| Djibouti | 50.0% | 2025 |
| Egypt | 24.8% | 2025 |
| Equatorial Guinea | 25.1% | 2025 |
| Eritrea | 25.8% | 2025 |
| Eswatini | 36.7% | 2025 |
| Ethiopia | 17.2% | 2025 |
| Gabon | 29.4% | 2025 |
| Gambia | 39.8% | 2025 |
| Ghana | 27.5% | 2025 |
| Guinea | 33.9% | 2025 |
| Guinea-Bissau | 13.6% | 2025 |
| Kenya | 19.5% | 2025 |
| Lesotho | 38.1% | 2025 |
| Liberia | 14.8% | 2025 |
| Libya | 30.5% | 2025 |
| Madagascar | 24.4% | 2025 |
| Malawi | 21.8% | 2025 |
| Mali | 27.2% | 2025 |
| Mauritania | 36.7% | 2025 |
| Mauritius | 17.5% | 2025 |
| Morocco | 32.6% | 2025 |
| Mozambique | 19.3% | 2025 |
| Namibia | 30.7% | 2025 |
| Niger | 16.1% | 2025 |
| Nigeria | 13.5% | 2025 |
| Rwanda | 26.0% | 2025 |
| Sao Tome and Principe | 50.4% | 2025 |
| Senegal | 35.3% | 2025 |
| Sierra Leone | 30.8% | 2025 |
| Somalia | 43.6% | 2025 |
| South Africa | 34.7% | 2025 |
| Tanzania | 11.1% | 2025 |
| Togo | 13.1% | 2025 |
| Tunisia | 22.9% | 2025 |
| Uganda | 13.3% | 2025 |
| Zambia | 29.1% | 2025 |
| Zimbabwe | 30.1% | 2025 |
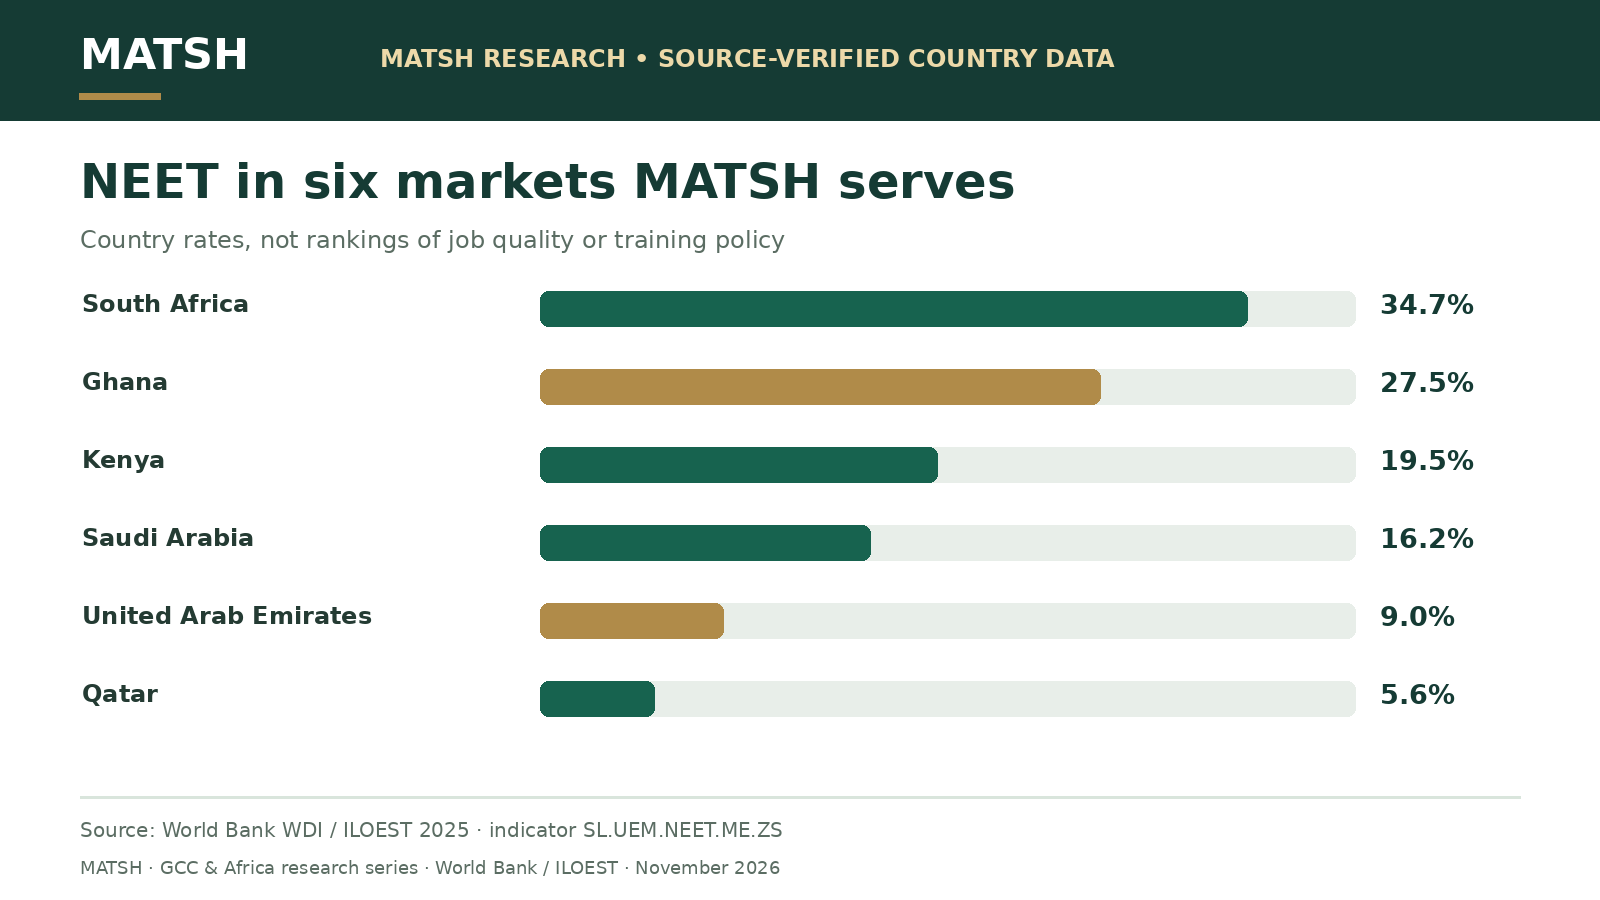
Examples of why interpretation matters: South Africa’s modelled NEET rate of 34.7% coexists with a very different economy from Nigeria, at 13.5%. It would be incorrect to infer that Nigeria therefore offers more high-quality wage employment. Informal employment, self-employment and unpaid family work can influence labour-market indicators in ways a NEET headline does not explain. A programme evaluator should pair this series with education completion, formal employment, earnings, and job-quality measures.
Five comparisons readers frequently get wrong
Different numerators and denominators. Unemployment refers to the active labour force; NEET also captures many inactive non-students.
Harmonised ILO modelled estimates are useful for comparison. National survey releases can differ and should be labelled as such.
The World Bank’s Arab World NEET aggregate covers more countries than the six GCC members, so it is not a GCC average.
Leaving the NEET category does not, by itself, establish a safe or productive job, lasting employment, or economic mobility.
Two countries with the same percentage can have very different numbers of young people affected because their youth populations differ.
A falling national NEET rate cannot establish that an individual employment programme caused the change.
5.6%
9.0%
16.2%
19.5%
27.5%
34.7%
These are illustrative country-level comparators, not a sample average. Source: World Bank / ILOEST, 2025.
The modelled 2025 estimate for Sub-Saharan Africa is 21.4% and the corresponding Arab World series is 29.7%. Neither number is an average of the GCC countries and selected African economies listed here. Those official aggregates have separate geographic definitions. Comparing the figures without explaining this would mislead readers.
How a youth programme should use NEET evidence
A sensible intervention begins by segmenting the local population. A young person who completed secondary education and is actively seeking work may need a different service from someone with interrupted schooling, care responsibilities or a disability-related accessibility barrier. Training is one possible intervention, not a universal answer.
Questions for GCC programme teams
Does the local estimate describe citizens or residents? How does the education-to-work transition operate for the relevant population? Which youth groups are not adequately reached by employer hiring channels? Are apprenticeships and employer-linked placements feasible for the target occupations? The answer should be grounded in the local labour force and employer context, not copied from a general regional chart.
Questions for African programme teams
Does the intended definition of employment include own-account, seasonal or informal work? Is lack of schooling, low school quality, poor transport, weak labour demand or care responsibility the dominant constraint? Are the proposed wage jobs actually available locally, and are young people able to access them safely? A programme may need income support, entrepreneurship infrastructure or agricultural value-chain connections rather than classroom training alone.
What to measure alongside NEET
- School enrolment, completion and transition to further education.
- Employment-to-population rate, earnings, hours and formality, with consistent definitions.
- Sex-disaggregated participation, where directly comparable data exist.
- Access to services by rural/urban location, disability and socioeconomic group, subject to safe data practices.
- Employer demand, vacancies, apprenticeship availability and placement quality.
- Verified retention at six and twelve months where a programme can legitimately observe outcomes.

A careful comparison with directly observed national releases
The WDI has a separate indicator for nationally reported NEET rates. For example, it shows Saudi Arabia at 16.4% in 2025, compared with 16.2% for the 2025 modelled series, and South Africa at 34.6% from a 2024 national observation compared with 34.7% for 2025 modelled data. Nigeria’s latest national value in that series is 11.9% for 2024, whereas its 2025 modelled estimate is 13.5%. These are not interchangeable or an apples-to-apples annual trend. Differences may reflect year, methodology, revisions, or survey coverage. Source selection must be documented for each comparison.
Original charts and graphics to share and cite
Each graphic is an independent, source-labelled MATSH visualisation. Open or save the full-resolution PNG, and credit MATSH for the design and World Bank WDI / ILOEST for the underlying data. Do not change the reference year, sample definition or caveats when sharing.
Download, source code and reproducibility
Download the source-labelled 2025 country CSV (57 rows). The download includes the country, region, reference year, percentage, indicator code and primary-source URL. Values are re-presented from World Bank WDI, sourced from ILOEST, under the World Bank’s displayed CC BY 4.0 terms. The table contains all six GCC countries and 51 African countries with the 2025 figure accessible in the source at compilation.
Calculation rules: rates are percentages of youth aged 15–24; values are shown to one decimal place as displayed in WDI; the table is not population-weighted into a new GCC or African average; no extrapolated or invented annual change is presented. Ranking-like top/bottom graphics sort only the countries included. Source retrieval and methodology must be rechecked when ILO revises its modelled series.
Frequently asked questions
What does NEET mean?
Not in employment, education or training: the share of people aged 15–24 in none of those three activities during the statistical reference period.
Is youth NEET the same as youth unemployment?
No. Youth unemployment excludes many young people not actively participating in the labour force, while NEET is expressed as a percentage of all youth.
Which GCC country has the lowest 2025 modelled NEET rate?
Qatar, at 5.6% in this specific WDI/ILOEST series. This is an all-resident modelled figure, not a citizen-specific rate.
Does the country with the lowest NEET rate have the strongest youth job market?
Not necessarily. Job quality, wages, participation, education, informal work and population composition must also be considered.
Can a national programme claim credit if the rate falls?
Not from this statistic alone. An impact claim needs an evaluation design, suitable comparison or counterfactual, and direct outcome measures.
Further MATSH reading
- Youth unemployment statistics in the Arab States and Africa, a different labour-market measure.
- Youth employment in Africa, including job quality and informality.
- Impact measurement for youth employment programmes.
Turn youth data into an implementable programme
Use these indicators to identify who needs services, validate the barriers and design measurable pathways into education, training or employment. MATSH works in youth programme design, management and impact measurement.
Youth Development ManagementImpact Measurement CourseDiscuss an in-house programme
Primary sources and licensing
- World Bank WDI, NEET rate, ILO modelled estimates, SL.UEM.NEET.ME.ZS.
- World Bank, Arab World country cross-section, modelled 2025 rates.
- World Bank, Sub-Saharan Africa cross-section, modelled 2025 rates.
- World Bank, separately reported national NEET series.
- ILOSTAT labour force statistical definitions and calculation.
- ILO: Measuring what matters, NEET vs youth unemployment (2025).
This is an editorial compilation, not an original MATSH household survey. Updates will be versioned if the source revises figures. Published source data are attributed under the displayed CC BY 4.0 licence. Article status: draft pending image, chart, accessibility, source and browser review.