Most Educated Countries in Africa? A 2026 Data Guide to Comparing Education
August 2, 2026 · Education · 7 min read
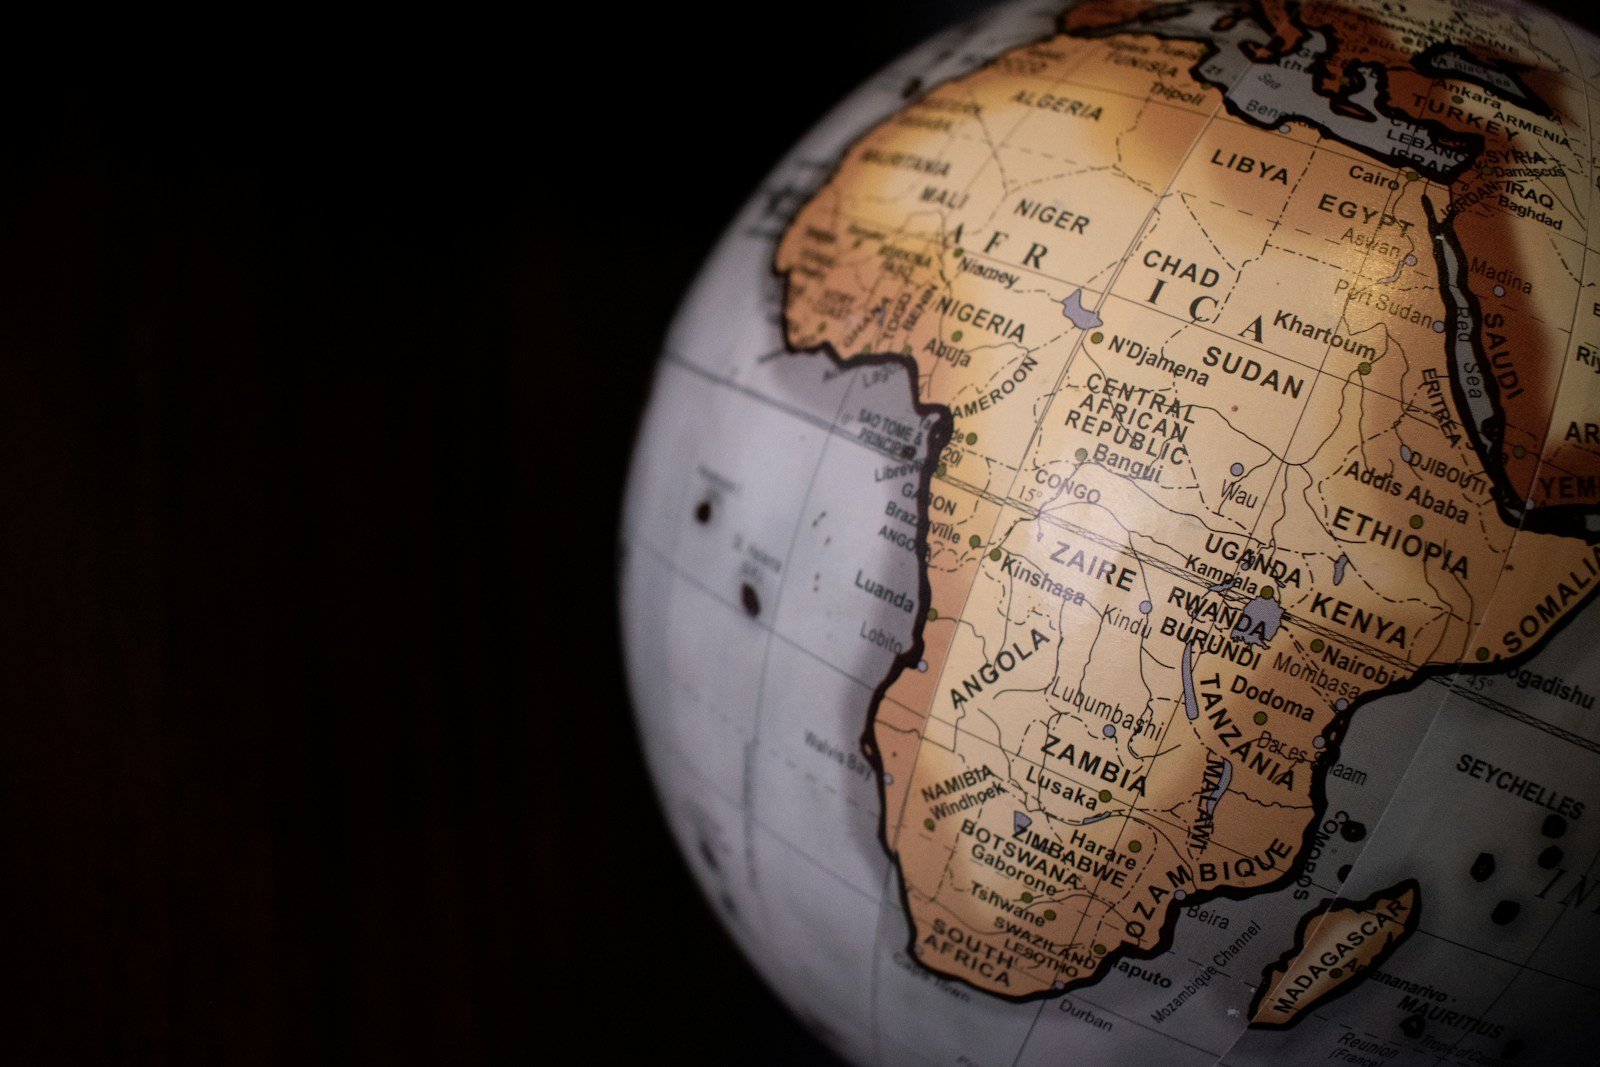
Searches for the “most educated countries in Africa” often produce a neat top-10 ranking. The problem is that there is no single official measure called “most educated,” and different education indicators answer different questions.
Adult literacy measures whether adults can read and write a short simple statement with understanding. Tertiary gross enrolment measures participation in higher education relative to the population of the official tertiary-age group, regardless of the actual age of enrolled students. UNDP’s education dimension instead combines mean years of schooling among adults with expected years of schooling for children.
Those are related indicators, but they are not interchangeable. A credible comparison therefore needs to show the metric, the reference year and the limits of the data rather than turning several different indicators into one unexplained ranking.
There is no official “most educated country in Africa” ranking
UNESCO’s Institute for Statistics (UIS) publishes internationally comparable education indicators for countries, including literacy, completion, learning outcomes, tertiary participation, teachers and education financing. Its 2026 data refresh expanded the global SDG 4 database to more than 8.26 million country datapoints.
Source: UNESCO Institute for Statistics, 2026 Education Data Refresh
What UIS does not do is combine all of those indicators into one universal league table called “most educated countries.” Any website that publishes such a list has therefore chosen its own methodology, whether or not it explains that methodology.
A more useful approach is to compare countries across several dimensions.
Five indicators worth comparing
| Indicator | What it helps answer | Main caution |
|---|---|---|
| Adult literacy rate | How widespread basic reading and writing ability is among people aged 15+ | Survey methods and reference years differ between countries |
| Mean years of schooling | How many years of education adults have completed on average | Does not directly measure learning quality |
| Expected years of schooling | How many years a child entering school can expect under current enrolment patterns | Reflects access/participation patterns, not guaranteed completion |
| Upper-secondary completion | How many learners complete a key stage before tertiary education or work | Completion does not by itself show what students learned |
| Tertiary gross enrolment ratio | Scale of participation in higher education | It is an enrolment ratio, not the percentage of adults with a degree |
1. Adult literacy: useful, but not enough on its own
The World Bank’s education database, using UNESCO UIS data, defines the adult literacy rate as the percentage of people aged 15 and above who can both read and write with understanding a short simple statement about everyday life.
Source: World Bank / UNESCO UIS adult literacy metadata
Recent available values illustrate why both the number and the year matter. Mauritius is reported at about 94% adult literacy for 2023. Nigeria is reported at about 70% for 2024. Seychelles also appears around 94%, but its latest value in the same international series is from 2010.
Source: World Bank / UNESCO UIS adult literacy series
It would be misleading to place those countries into a 2026 league table as if every figure had been measured in the same year. The World Bank also cautions that literacy can be measured through censuses, surveys, self-report or proxies, so cross-country comparisons should be interpreted carefully.
2. Years of schooling: a different view of educational attainment
UNDP’s Human Development Index treats education as a separate dimension of human development. Its education component combines:
- mean years of schooling for adults aged 25 and older; and
- expected years of schooling for a child of school-entry age.
Source: UNDP Human Development Index methodology
This approach captures something literacy rates cannot. Two countries can both have high basic literacy while differing substantially in how long people stay in formal education.
It still does not create a complete education-quality ranking. Years spent in school do not automatically tell us what students learned, how equal access is, or whether skills transfer into employment.
3. Completion matters before tertiary education
UNESCO’s 2026 data refresh reports that in Sub-Saharan Africa only 29% of young people complete upper-secondary education, compared with 62% globally.
The same update reports that, at the age when children should have completed primary school, only about half reach minimum proficiency in reading and around 40% reach minimum proficiency in mathematics.
Source: UNESCO Institute for Statistics, 2026 Education Data Refresh
These regional figures are not country rankings. They show why a serious education comparison needs to consider progression and learning rather than only university participation.
4. Tertiary participation can tell a very different story
The tertiary gross enrolment ratio is often misunderstood. It is the total number of people enrolled in tertiary education, regardless of age, divided by the population of the age group that officially corresponds to tertiary education.
Source: World Bank / UNESCO UIS tertiary enrolment metadata
Because students outside the official age group are included, this is not the same as the percentage of adults who hold a university degree.
Recent UIS data distributed through the World Bank show substantial variation across African countries. Examples include:
| Country | Latest tertiary gross enrolment ratio shown | Reference year |
|---|---|---|
| Algeria | 66% | 2024 |
| Morocco | 53% | 2024 |
| Tunisia | 49% | 2023 |
| Egypt | 39% | 2025 |
Source: World Bank / UNESCO UIS tertiary enrolment series
These figures are useful for comparing participation in higher education. They should not be converted into a claim that one country’s population is simply “more educated” than another’s.
5. Learning outcomes should not be ignored
Enrollment and completion tell us whether learners enter and progress through education. Learning assessments tell us something different: whether students reach defined levels of proficiency.
UIS and the African Union align their regional education monitoring with SDG 4 indicators that include minimum proficiency in reading and mathematics, completion rates, literacy, tertiary participation and education financing.
Source: UNESCO UIS, African education strategy and SDG 4 indicator alignment
A country can therefore expand access while still facing a learning-quality problem. Another may have relatively strong learning outcomes but unequal access. A single score can hide these differences.
Why old “top 10” lists become unreliable
Four recurring problems make education rankings fragile.
Different reference years
Country data are not always collected in the same year. Treating a 2010 literacy estimate and a 2024 estimate as simultaneous 2026 observations creates false precision.
Different indicators
Literacy, tertiary enrolment, completion and years of schooling measure different things. Combining them requires explicit weighting choices.
Gross enrolment is not attainment
A high tertiary gross enrolment ratio does not mean the same percentage of adults has completed a degree.
Access is not the same as learning
Years in school or enrolment rates cannot substitute for evidence about whether learners acquire minimum competencies.
A better way to compare education systems in Africa
If you need to compare countries for workforce planning, research or training strategy, build a small dashboard rather than a league table.
For each country, record:
- adult literacy rate and reference year;
- mean years of schooling;
- expected years of schooling;
- upper-secondary completion;
- tertiary gross enrolment;
- learning-outcome data where comparable;
- gender or income disparities where relevant;
- the source and observation year for every figure.
Then interpret countries by dimension instead of forcing them into a single rank.
What the continental picture shows in 2026
The broader African education story is not simply a contest between “most” and “least” educated countries. UIS’s 2025 Africa SDG 4 Scorecard estimates that 118 million children, adolescents and youth are out of school across Africa. It tracks eight indicators against nationally set benchmarks rather than trying to rank countries with one composite score.
Source: UNESCO UIS, 2025 Africa SDG 4 Scorecard
At the same time, the 2026 UIS refresh shows continuing expansion of education data coverage. Better data makes it increasingly possible to compare specific outcomes, but it also makes simplistic one-number rankings less defensible.
So which country is the “most educated” in Africa?
There is no single evidence-based answer unless you first define what “educated” means.
If you mean basic literacy, use the latest comparable literacy data and state the year. If you mean accumulated schooling, use mean years of schooling. If you mean access to higher education, use tertiary participation or attainment. If you mean education-system effectiveness, add completion and learning outcomes.
The correct conclusion is therefore not a universal top-10 list. It is a transparent comparison where the indicator, population and observation year are visible.
Related MATSH research
For a closer look at the education pipeline, see Youth Education in Africa 2026. For the transition from education into work, see Youth Employment in Africa 2026.
Sources and data tools
- UNESCO Institute for Statistics — 2026 Education Data Refresh
- UNESCO UIS — World Education Statistics 2025
- UNESCO UIS Data Browser
- World Bank / UNESCO UIS — Adult literacy rate
- World Bank / UNESCO UIS — Tertiary gross enrolment
- UNDP — Human Development Index education methodology
- UNESCO UIS — Africa SDG 4 Scorecard
Need In-House Training?
We run all our courses as private programmes for organisations across the GCC and Africa.
Request In-House →